MATERIALS OF CONSTRUCTION / VIRTUAL LABORATORY
Small particles.
Big differences.
Discover how aggregate shape, size and moisture influence a concrete mix. Build your intuition, one experiment at a time.
Start exploringExplore the aggregate labs
13 interactive experimentsShape & packing
Round or crushed? Explore grading, compaction and the space between particles.
Live packing model 02 / WATER & PORESMoisture states
Look inside a particle. Move from oven-dry to SSD and surface-wet conditions.
Particle explorer 03 / MIX DESIGNGradation blending
Blend three aggregate sources to bring a sieve curve inside a fixed grading envelope.
ASTM C33 grading challenge 04 / LAB MEASUREMENTSSieve analysis
Turn retained masses into percent passing and calculate fineness modulus.
From sample to curve 05 / CONCRETE BATCHINGBatch water correction
Adjust aggregate and free water to match an SSD mix design.
Interactive mixing experiment 06 / PROPERTIES & DENSITYSpecific gravity & absorption
Weigh one sample oven-dry, surface-dry and suspended to unlock density and pore capacity.
Three-balance bench 07 / FILL & WEIGHBulk density & voids
Scoop, rod and vibrate one measure, then turn the masses into voids between grains.
Bucket bench 08 / SITE PRACTICEBulking of sand
Watch a moist pile grow, find the hidden peak, and fix volume batching to match.
Field test bench 09 / SHAPE QUALITYFlakiness & elongation
Run the 0.6 and 1.8 gauges over a sample and judge shape quality against the BS limits.
Gauge bench 10 / TOUGHNESSToughness & wear
Hammer blows and a steel-ball drum decide which stock survives traffic.
Impact + LA bench 11 / CLEANLINESSCleanliness
Run the colour test and the wash test, then tick the source for acceptance or rejection.
Colour + wash bench 12 / DURABILITYASR screening
Soak prisms for a year, read the reactivity class, then suppress it with the right binder.
Prism tank + mitigation 13 / CIRCULAR MIXRecycled aggregate
Blend old concrete back into a trial mix and review strength, shrinkage and the source screens.
Capstone mix benchAGGREGATE / LAB 01
Make room. Then reduce it.
Explore how particle shape and grading affect packing. Predict the change before applying compaction.
Your aggregate
Conceptual teaching model, not a calibrated packing simulation or ASTM test. Chart values follow an illustrative porosity model; the 2D drawing is schematic, not a measurement of those values. Solid volume is constant during compaction. Scaling all particles alone does not change model porosity. Homogeneity controls initial fines distribution. This illustrative model assigns segregated samples a higher void fraction and a smaller compaction benefit; these scenario coefficients are not measured predictions. Vibration illustrates local settling, not mixing: initially segregated samples remain segregated. Effort is a demonstration control, not calibrated vibration time or energy. Crushed aggregate is not universally denser than rounded aggregate under compaction. TRB: compacted void content and angularity.
AGGREGATE / LAB 02
Where does the water go?
Dry pores, filled pores, or surface water: see the difference.
1. Explore a particle
Change total moisture and absorption. Both percentages use oven-dry aggregate mass as the denominator.
SSD means the water-accessible pores are saturated; isolated pores can remain air-filled. Surface-dry means no external water film. Here, moist means partly filled pores.
Inside the pore network
Move the mouse over the circular magnifier to follow the narrow channels and the small pore-to-pore branches. Hatched pores are sealed off from this network.
Water enters through surface-connected pathways. Permeable / accessible pores can absorb water. Impermeable / isolated pores have no water-accessible connection in this model and remain unfilled, even at SSD or above SSD.
Isolated pores are shown for explanation only: they add no absorption or water correction. Absorption A represents accessible water capacity; the drawn pore and channel areas are not used in any calculation. Connectivity alone does not specify absorption speed or guarantee complete filling during short exposure. FHWA: aggregate pores and absorption.
Higher absorption enlarges the illustrated accessible pores. This shows water-holding capacity, not measured pore size or porosity. Schematic only: pore shapes, film thickness, and water distribution are illustrative, not a measured microstructure.
AGGREGATE / LAB 03
Find the balance.
Blend three fine-aggregate stockpiles. Bring the combined percent-passing curve inside the fixed grading limits.
Your blend
Percentages are by dry mass. Moving one slider redistributes the other two to keep the total at 100%.
Check each sieve
Teaching envelope: ASTM C33/C33M fine aggregate Table 1 (9.5 mm to 150 µm). Synthetic source curves. Passing these sieve limits alone does not establish full ASTM compliance; other grading and material-quality requirements apply. ACI grading table reference · ASTM specification scope.
AGGREGATE / LAB 04
From sieve to curve.
Enter the mass retained on each sieve, including the pan. Follow the mass balance into the grading curve.
01 / SETUP
Prepare your sample
Changing sample mass scales all retained masses while keeping the same grading proportions.
Removing a sieve moves its mass to the next finer sieve or pan. Adding a sieve starts it at zero; edit its measured mass below.
02 / SEPARATION
From coarse to fine
Illustrative particles; counts and sizes are not to scale. Retained percentages use the original dry sample mass.
03 / MEASUREMENTS
Record retained mass
04 / RESULTS
Grading curve
Percentages use the original dry mass. FM requires the standard 9.5 to 0.15 mm series and a sample passing 19 mm. Example samples are synthetic teaching data.
AGGREGATE / LAB 05
Can you match the design?
Move the sliders and watch water move between the aggregate and the mix.
THE ASSUMED MIX DESIGN
Your target: SSD aggregate + free water
Choose the aggregate condition
Both percentages are based on oven-dry aggregate mass.
01 / BEFORE MIXING
Choose what goes in
Drag to explore. Use the −/+ buttons or arrow keys to fine-tune by 0.01 kg.
02 / AFTER MIXING
See where the water goes
Illustrative particle cross-sections. The experiment assumes water can fill the accessible pores during mixing; it does not model absorption speed. Green means both masses are within 0.05 kg of the reference.
AGGREGATE / LAB 06
Weigh it three ways.
Balance the same sample oven-dry, surface-dry and suspended in water. Three masses unlock specific gravity and absorption.
Your sample
FROM THE MASSES
Specific gravity and absorption
Density class: —
Absorption class: —
Teaching model of the ASTM C127/C128 index computations. The balances read to 0.1 g and the sample masses are illustrative; real procedures fix the sample size and require saturated, towel-dried and wire-basket weighings in a specified sequence. The absorption found here feeds the batch-water lab (05).
AGGREGATE / LAB 07
Fill the bucket.
Scoop, rod and vibrate the same measure. Weigh each full bucket to find bulk density and the void fraction between grains.
The measure
Use the oven-dry bulk SG from lab 06. Voids compare the bucket density against the solid density SG × 1000 kg/m³.
YOUR WEIGHINGS
Mass of aggregate in the full measure
Conceptual bench in the style of ASTM C29 / IS 2386 Part III. Readings are illustrative; real procedures fix the measure size, layer counts and tamping strokes.
AGGREGATE / LAB 08
Why three buckets fill two.
Moist sand puffs up. Find the bulking peak, then work out how much moist sand a volume-batched mix really needs.
The wet pile
WHY IT PEAKS
Bulking versus moisture
Bulking grows while the surface-tension films thicken, peaks, then falls to zero at saturation, where the films merge and the grains settle. Anchors are illustrative envelopes: the manufactured-sand peak of about 40 % follows Shetty's description of very fine material.
VOLUME BATCHING
Measure the moist volume the design needs
Volume batching counts bulked volume; weigh batching does not care. As the sand dries or soaks, the same scoop delivers different amounts of grain — the classic site trap behind undersanded, harsh mixes.
AGGREGATE / LAB 09
Cubes, wafers, rods.
Pass a coarse-aggregate sample through the thickness and length gauges. Flat and long particles get counted, and the two shape indices come out.
The stockpile
THE TWO INDICES
Flakiness and elongation
Flakiness: —
Elongation: —
Teaching model of the IS 2386 Part I gauges: a particle is flaky when its least dimension is under 0.6 of the mean dimension, and elongated when its greatest dimension exceeds 1.8 of the mean. BS 882 (1992) caps flakiness at 40 for crushed coarse aggregate and 50 for natural gravel; the Indian standards give the method but no limit, and wearing surfaces want lower values. The 16-particle sample, its equal masses and the crusher tendencies are illustrative.
WHY IT MATTERS
Shape on the road
Flaky and elongated particles pack badly, lower workability at the same water content, and tend to lie flat and break along their thin section. In bituminous and concrete wearing courses they polish or fracture unevenly, so surface courses are usually capped well below the general flakiness limits. Rounded gravel can pass the flakiness limit yet still skid-polish: shape indices are a durability screen, not a full surface-course specification.
AGGREGATE / LAB 10
Hammer and drum.
Run the impact tester and the Los Angeles drum on the same stock. Two tests, two wear limits, one pavement decision.
The stockpile
THE TWO INDICES
Toughness and wear
Impact: —
Abrasion: —
Teaching model of the IS 2386 tests as described by Shetty: the impact value comes from 15 blows of a 14 kg hammer (fines under 2.36 mm, limits 30 % wearing / 45 % other), and the LA abrasion value from a steel charge in a revolving drum (grading A: 12 spheres, 500 revolutions, loss on 1.7 mm, limits 30 % wearing / 50 % other). Rock values are illustrative teaching numbers ordered after Shetty's rock-group table; the cup and drum masses are typical rather than certified. Run the drum to watch the steel charge: it is carried up the rising wall, then cascades back down onto the tumbling grains. Run the impact tester to watch all fifteen blows land as the fines build up.
WHERE IT CAN GO
Applications this stock can be used for
Ticks follow the two limit pairs as the tests run: wearing courses need both indices within 30 %, foundations and mass concrete allow up to 45 % impact and 50 % abrasion, and bases or fill stay usable while at least one test is within those general limits. A stock over both pairs is rejected for structural use.
WHY IT MATTERS
Toughness on the road
Wearing surfaces take the traffic directly: aggregates must resist impact (hammer) and attrition (drum) without disintegrating, or the surface ravels, polishes and loses texture. Strength under slow crushing, sudden impact and abrasion are different properties: a limestone can pass the impact limit and still fail the drum. Abrasion and impact tests screen durability; skid resistance (polished-stone value) is a separate, surface-specific test.
AGGREGATE / LAB 11
Wash it. Colour it.
Two old site tests decide whether a sand is clean: the organic colour test against the tannic-acid standard, and the wash test for silt and clay.
The sand source
THE READINGS
Colour and silt
Teaching model of the IS 2386 Part II colour test (350 ml bottle, 3 % NaOH, sand to the 125 ml layer, liquid compared with a freshly prepared tannic-acid standard) and of the IS 383-1970 wash limits: material finer than 75 µm is capped at 3 % for natural sand and 15 % for crushed rock sand; clay lumps, coal and lignite are each capped at 1 % and the total of deleterious substances at 5 %. A sand darker than the standard may still be used if the mortar keeps 95 % of the reference strength at 7 and 28 days.
WHAT ELSE TO LOOK FOR
Potentially harmful materials
From PCA's harmful-materials list: organic impurities delay setting and hardening and reduce strength gain; silt and clay coatings weaken the paste bond and raise water demand; coal, lignite and other lightweight particles cause stains and popouts; soft particles wear away; clay lumps absorb water, swell and pop out; mica plates cut strength; iron oxides and sulfides leave unsightly stains. The colour and wash tests above screen the two most common problems; the rest are checked when a new source has no service history.
AGGREGATE / LAB 12
Slow cracks, long years.
Screen a rock for alkali-silica reactivity with the one-year concrete prism test, then bring a reactive stock under control with the right binder.
The rock
THE EXPANSION
Reactivity class and suppression
Teaching model of the one-year concrete prism test (ASTM C1293) and PCA Table 6-8 classes: R0 non-reactive below 0.040 %, R1 0.040-0.120 %, R2 0.120-0.240 %, R3 above 0.240 %. The control target is 0.04 % at optimum dosage; PCA notes that roughly 35 % slag is typical for moderately reactive aggregates and up to 50 % for highly reactive ones, with Class F fly ash the best ash choice (efficiency falls as its CaO content rises). Verify every combination with C1567 or C1293.
MANAGE IT, DON'T JUST BAN IT
From screening to mitigation
Rapid screens (C1260 and C1567: 16 days in 1 N NaOH at 80 °C) give a first read but carry false positives and false negatives; the one-year prism test is the reference, and field service history is the best guide of all. PCA's advice is not to disqualify a reactive aggregate outright: control it with the right cementitious system, watch the alkali supply, and verify the combination. The same problem is waiting as the ASR design brief in the cement blended-binders lab.
AGGREGATE / LAB 13
Give the old concrete a second life.
Blend recycled-concrete aggregate into a trial mix and watch density, water demand, strength and shrinkage move. The coarse and fine fractions behave very differently.
The demolition source
THE MIX REVIEW
What the trial says
Teaching model from PCA Chapter 6: recycled aggregate keeps a crushed-rock shape and the relative density falls as the particle size falls (coarse 2.35, fine 2.20 here); sulfate and chloride are determined for demolition sources; coarse-only mixes generally reach adequate strength while recycled fines give minor reductions unless the proportions are adjusted; drying shrinkage and creep run up to 100 % higher, driven mainly by the recycled fines. Absorption rises too, which lands straight in the batch-water correction of lab 05.
MATERIALS OF CONSTRUCTION / VIRTUAL LABORATORY
From raw rock.
To reactive powder.
Explore how cement is manufactured and how its compounds react with water to bind a concrete mixture together.
Start exploringExplore the cement labs
7 learning modulesCement manufacturing
Trace raw materials through crushing, proportioning, grinding, burning, cooling and dispatch.
Interactive plant explorer 02 / COMPOSITIONClinker chemistry
Turn an oxide analysis into the four Bogue compounds and check the ratios that control the kiln.
Interactive calculator 03 / HYDRATIONCement reaction
Explore what happens when cement meets water and hydration products begin to form.
5-step interactive lab 04 / LABORATORY TESTSCement testing
Run the consistency, setting, soundness and fineness benches and judge them against the ASTM limits.
4 virtual test benches 05 / TYPES & SELECTIONCement types
Compare the portland and blended cement families, then match them to real job briefs.
Gallery + selection game 06 / BLENDED BINDERSBlended binders
Replace clinker with slag, fly ash, silica fume or limestone and trade early strength for heat, durability and carbon.
Binder designer + carbon target 07 / HEAT IN THE POURHeat & mass concrete
Simulate a thick pour: core against surface temperature, seven days of cooling and the cracking limit.
7-day thermal simulationThe overview artworks are drawn for this module; the photographs used inside the labs are credited there.
CEMENT / LAB 01 / MANUFACTURING
From quarry to cement.
Follow the material through the plant. Select a raw material to see its photograph, or inspect a machine to discover what happens inside.
On a small screen, swipe the diagram sideways or use the component menu above.
Simplified teaching schematic, not a plant layout. Clay and shale are alternative or combined raw-feed sources; gypsum is introduced at finish grinding, after the kiln.
Process references and photo credits
American Cement Association: How cement is made · Heidelberg Materials: Manufacturing · Continental Cement: Process stages · Understanding Cement: Clinker reactions
CEMENT / LAB 03 / HYDRATION
When cement meets water.
Hydration is a chemical reaction, not drying. It starts the moment water touches cement and keeps going for weeks and months while water remains available. Choose a clinker composition, then move the clock through the five steps below: composition, reaction rates, heat, products and curing.
The master clock moves every graph together, so you can compare the same moment. Each graph also has its own play button underneath, to run that animation on its own.
REACTED CEMENT, α
0%
Stage I · Initial dissolution
Heat released so far: 0 J/g of cement. This is the degree of hydration: the fraction of cement that has actually reacted.
YOUR CLINKER
Play with the four compounds.
Almost all of cement is four reactive compounds. Move a slider to change the clinker, or load a known type.
The four sliders always add up to 100%. Real clinker also carries a few percent of minor phases (alkalis, MgO, free lime) that are left out here.
- C₃S (alite) is usually the largest share and the workhorse of early strength. It reacts quickly and gives off plenty of heat.
- C₂S (belite) is the slow one. It reacts over months and keeps adding strength long after the others have slowed down.
- C₃A reacts fastest of all and would stiffen the paste within minutes if it were not held back by gypsum (step 02).
- C₄AF reacts at a moderate pace, contributes little strength and gives grey cement its colour.
Rate of reaction of each compound.
Reaction rate against time on a logarithmic axis, so minutes and months fit on one chart. The clock draws the curves; the faint part is still ahead.
Gypsum dissolves and releases sulfate. The sulfate reacts with C₃A first and forms a protective layer, so the aluminate cannot flash-set. Without enough sulfate, C₃A reacts within minutes.
Sulfate is controlling the aluminate: workability is protected through the placing window.
Peak height scales with the share of that compound. Notice how far apart the peaks are: C₃A in minutes, C₃S in about a day, C₂S spread over months.
Heat evolution: rate and cumulative heat.
Rate of heat release and the heat released so far, with the five stages of hydration and the setting window. Play the clock and watch which stage you are in.
Setting is not drying: initial and final set happen within hours while products form. Water is not lost then; drying of the paste (evaporation) is a separate, slower process. Stage boundaries and the shape of the curve are illustrative; real plants measure heat directly (ASTM C186).
What forms when water reacts.
A single grain under the microscope, drawn to the clock. The gel layer grows on the grain surface while the grey core shrinks inside it.
2 C₃S + 6 H → C₃S₂H₃ + 3 CH
2 C₂S + 4 H → C₃S₂H₃ + CH
C₃A + 3 CSH₂ + 26 H → C₆AS₃H₃₂ (ettringite)
2 C₃A + C₆AS₃H₃₂ + 4 H → 3 C₄ASH₁₂ (monosulfate)
C = CaO, S = SiO₂ (or SO₃ in the sulfate compounds), A = Al₂O₃, F = Fe₂O₃, H = H₂O. The gel formula C₃S₂H₃ is the layer that coats the grains.
- C-S-H grows as a layer on the grain surface. It is not released as separate particles: the product coats each reacting grain. Inside the original outline it forms the denser inner product; beyond it the outer product pushes into the water-filled pores. When layers from neighbouring grains meet, the grains become bound together. C-S-H is the main binder: roughly 50–60% of the solid volume of a mature paste.
- The hydrated grain barely changes size. What shrinks is the unreacted core inside its shell of products. That core can survive for years, which is why the reacted percentage in step 05 stays below 100%.
- CH (portlandite, Ca(OH)₂) crystallises in the pore space beside the gel, forms about a fifth of the product mass and keeps the pore solution basic, which protects reinforcing steel.
- Ettringite (AFt) forms early, while sulfate is available, growing as needles from the gel surface into the pores. Once the sulfate is used up, it converts to monosulfate (AFm). Both are a few percent of the paste.
- As products fill the capillary pores from the surface inward, porosity drops and the paste becomes denser and stronger. The drawing is schematic; the real microstructure is finer and more irregular.
Time and curing: how much has reacted?
Degree of hydration, α, against time for your clinker, then compare a moist-cured paste with one that dried out.
- Hydration never finishes overnight. Even under ideal moist curing only about 60–80% of the cement has reacted at 28 days, and roughly 85–95% after a year. The model curve in this lab follows that behaviour.
- The reaction needs water and space. Once the paste dries out, the remaining clinker can keep its unreacted cores for years: drying stops hydration, so the reacted percentage freezes.
- Curing is the site work of keeping water in the concrete: wet coverings, curing compounds, or simply keeping it damp. It is what lets the reacted percentage keep climbing toward its long-term value, and it is why curing affects strength and durability even though the concrete already looks hard after a day.
- Unreacted cement is not wasted material: in a mature paste the unhydrated cores act as fine filler inside the dense product. Under water, or in a sealed specimen with enough water, hydration can continue for years and the reacted percentage slowly rises.
Notes, model limits and references
What this lab models. The degree of hydration is the share-weighted extent of the four main compounds. Each compound follows an illustrative extent curve (a saturating reaction held back by a dormancy gate) with its own rate constant; heats are approximate totals of complete hydration in J/g of compound (C₃S ≈ 500, C₂S ≈ 260, C₃A ≈ 865, C₄AF ≈ 420). Coefficients were chosen so a typical moist-cured paste reaches about 20% at 1 day, 65% at 7 days, 80% at 28 days and 90% at 1 year; they are demonstration values, not a kinetic model fitted to a particular cement.
Simplifications. Temperature is assumed constant (a warm paste reacts faster); w/c ratio, admixtures, alkalis, sulfates and filler effects are not modelled; drying is treated as an ideal stop, whereas real pastes slow down before they stop. Gypsum amount is a yes/no switch, not a dosage.
Understanding Cement: hydration of Portland cement · ASTM C186: heat of hydration of hydraulic cement · American Cement Association: how cement is made. Ranges quoted here follow standard cement and concrete technology texts (Neville; Mindess, Young & Darwin; Kosmatka et al.).
CEMENT / LAB 02 / CLINKER CHEMISTRY
From oxides to compounds.
The kiln turns calcium, silicon, aluminium and iron oxides into four reactive compounds. Enter a chemical analysis, read the Bogue calculation and check the ratios that control the burn — then send the result straight to the reaction lab.
Oxide analysis
Percent by mass of the cement, as a chemical analysis reports it (ASTM C114). The five oxides feed the equations; everything else is ignored.
The four compounds are normalised to a 100% reactive mix and loaded into step 01 of the reaction lab, where you can watch this exact composition react.
- The four compounds are not in the bag. A cement analysis reports oxides; Bogue's equations turn them into the imagined compounds C₃S, C₂S, C₃A and C₄AF. The equations and rounded coefficients used here are the ones in ASTM C150 and in Shetty's Concrete Technology, Ch. 1.
- Lime saturation factor. LSF = (CaO − 0.7 SO₃) / (2.8 SiO₂ + 1.2 Al₂O₃ + 0.65 Fe₂O₃). IS 269 keeps it between 0.66 and 1.02; a modern kiln runs 0.92–0.98. Above the limit, lime cannot combine: it burns hard as free CaO and the autoclave soundness test (expansion ≤ 0.8 %) fails.
- Silica ratio and alumina ratio. SR = SiO₂ / (Al₂O₃ + Fe₂O₃) sets how much liquid phase forms while burning (2.5–3.5 usually); AR = Al₂O₃ / Fe₂O₃ decides how the alumina splits between C₃A and the ferrite.
- Why it matters downstream. Composition is destiny: C₃S carries early strength, C₂S the later strength, C₃A the fastest heat and the worst sulfate vulnerability (a Type V cement keeps C₃A at 5 % or less). Try a preset, then press send and watch the reaction lab pick it up.
Notes, model limits and references
What this lab models. Bogue's equations with the rounded coefficients of ASTM C150 / Shetty Ch. 1. Typical analyses are the means of ASTM C150 Types I, II, IV and V from Kosmatka et al., Design and Control of Concrete Mixtures, 15th ed., Table 3-6; the off-spec preset is a teaching example of an over-limed kiln feed.
Limits. Bogue assumes the oxides combine perfectly, so it ignores minor oxides, free lime, solid solution and kiln reality: real plants check the phase composition by X-ray diffraction (ASTM C1365). The clamps and warnings are teaching signals, not a kiln model. The transfer to the hydration lab normalises the four compounds to 100 %, so it re-enters the reaction model as a purely reactive mix.
ASTM C150: portland cement · ASTM C114: chemical analysis of hydraulic cement · Understanding Cement: clinker composition.
CEMENT / LAB 05 / TYPES & SELECTION
One clinker. Nine cements.
The same kiln chemistry is re-blended and re-ground into a whole family of cements. Meet the members, then take the job briefs and pick the right bag.
- Types are recipes, not strength grades. ASTM C150 prescribes the composition: Type I ordinary, II moderate sulfate (C₃A ≤ 8 %), II(MH) moderate heat, III high early (the same clinker ground much finer), IV low heat (belite-rich), V sulfate resisting (C₃A ≤ 5 %).
- Blends stretch the clinker. ASTM C595 names its blended cements by the addition: IS (slag), IP (pozzolan or fly ash), IT (both). Slag and fly ash cut the heat, improve long-term durability and reduce how much clinker a tonne of binder needs.
- One detail worth memorising: Type III is not a different clinker — it is Type I ground finer. Fineness buys one-day strength and costs heat of hydration.
- Selection logic. Ask in order: exposure (sulfate, chloride, ASR), strength schedule (24 hours or 28 days), heat (how thick is the pour), then appearance. The briefs grade you that way.
Specification systems, model notes and references
| System | Basis | Names | Note |
|---|
What this lab models. Typical compositions are the mean ASTM C150 analyses of PCA Table 3-6, scaled for the blends; heat, sulfate and ASR ratings are qualitative teaching labels consistent with PCA Ch. 3–4 and Tokyay Ch. 8–11. Real selection also weighs local availability, cost and the designer’s approval — PCA warns that no cement can simply be substituted across standard systems.
References: Kosmatka et al., Design and Control of Concrete Mixtures, 15th ed., Ch. 3 (cement types and specification systems) and Ch. 4 (blended cements and SCMs); Tokyay, Cement and Concrete Mineral Admixtures, Ch. 13 (ASTM vs EN requirements); ASTM C150, C595, C1157 and EN 197-1.
CEMENT / LAB 04 / TESTING
The tests the certificate depends on.
Four benches from a cement laboratory: find the normal consistency, watch the gypsum dosage decide when the paste sets, cook an unsound clinker in the autoclave, and grind a batch fine. Every verdict uses the ASTM limits quoted in the course books.
Normal consistency
ASTM C187 · Vicat plunger
Add water until the plunger settles 10 ± 1 mm above the base of the mould. That water content is the normal consistency every other paste test starts from.
Setting time
ASTM C191 · Vicat needle
The specimen is cast at the normal consistency found on bench 01. Gypsum controls the aluminate: too little and the paste flashes, the right dose sets in hours, an overdose stiffens early and recovers — the false set described in PCA.
Soundness
ASTM C151 · autoclave
Free lime from an over-limed kiln hydrates late and expands. The autoclave cooks a bar of paste until that expansion shows; the older Le Chatelier needles measure the same lime by another route.
Fineness
ASTM C204 · Blaine air permeability
Air permeability gives the specific surface in m²/kg. Fineness buys early strength and costs heat and grinding energy — which is why the types that must stay cool are capped.
- Consistency comes first. Almost every paste test starts from the normal consistency: the water content at which the Vicat plunger settles 10 ± 1 mm. Too much water here dilutes the meaning of every later result.
- Gypsum is a dosage, not a yes/no switch. On one and the same clinker, about 1 % plaster flashes the paste, 2 % gives a five-hour set and 3 % stiffens early and then recovers. The experiment is quoted in PCA from Helmuth et al.; the reaction lab shows the same balance from the chemistry side.
- Soundness is about lime the kiln left behind. Hard-burned free CaO hydrates long after the paste has set and tears it apart. The autoclave test (limit 0.80 % expansion, ASTM C151) is the referee; the older Le Chatelier needles check the same lime with a 10 mm limit.
- Fineness is traded, not maximised. Blaine fineness (ASTM C204) buys one-day strength but raises heat and grinding energy — why C150 sets a 260 m²/kg floor for most types and a 430 m²/kg ceiling for the heat-capped II(MH) and IV.
Notes, method references and limits
What this lab models. The four benches follow the standard test ideas (C187 consistency, C191 setting, C151 autoclave, C204 Blaine) with demonstration curves tuned to the values in PCA Ch. 3: plaster 1 % flash set, 2 % five-hour set, 3 % false set; initial set at least 45 min and final set within 375 min; autoclave expansion ≤ 0.80 %; Blaine 260 m²/kg floor and a 430 m²/kg cap for Type II(MH) and Type IV.
Limits. The curves are teaching shapes, not calibrated laboratory data; real cements vary with clinker, alkalis, temperature and w/c. The Le Chatelier reading is modelled proportionally to the autoclave expansion, because the two tests chase the same free lime by different routes.
References: Kosmatka et al., Design and Control of Concrete Mixtures, 15th ed., Ch. 3 (physical properties: consistency, setting time, false and flash set, fineness, soundness); Shetty, Concrete Technology, setting and testing sections; ASTM C187, C191, C151, C204 and C430.
CEMENT / LAB 07 / HEAT IN THE POUR
Thick pours keep their own weather.
The reaction lab plots heat per gram of cement; in a real section that heat becomes tens of degrees. Choose the pour, the binder and the site conditions: the model tracks the core against the surface for seven days and warns before the differential reaches the cracking zone.
- Everything comes from one curve. The heat released per gram of cement (reaction lab, step 03) is multiplied by the cement content and divided by the volumetric heat capacity (≈ 2185 kJ/m³·°C): that is the adiabatic temperature rise, the dashed reference on the chart.
- Why thick sections crack. The core sits at the peak while the surface cools toward the air, so the surface contracts against the restrained hot interior. Common field guidance caps the core-to-surface difference at about 20 °C — the gauge above is that limit.
- The four dials that matter. Binder (clinker share and release speed), cement content, section thickness (cooling time constant ≈ L²/π²α) and placement temperature. Hot concrete starts the race with a head start: roughly a doubling of the reaction rate per 10 °C, capped in the model.
- Standard mitigations, in order of effect: blend the binder (slag, fly ash), lower the cement content, precool the mix or the aggregates, insulate the forms so the surface cools more slowly, keep the forms on longer, pour in lifts — and on real dams, cooling pipes.
Notes, model limits and references
What this lab models. A lumped two-temperature model: the core integrates heat in (from HydrationMath, weighted by the binder's clinker share and release speed) minus cooling out toward the placement temperature; the surface rides at a fixed fraction of the core rise set by the formwork. The cracking rule is the common 15–20 °C core-to-surface guidance, not a stress calculation.
Limits. No reinforcement restraint, creep relaxation, real weather or cooling pipes are modelled; the placement temperature doubles as the ambient temperature; the Q10 acceleration is illustrative. The blended binders ignore pozzolanic heat beyond 7 days and take no credit yet for the later strength they deliver.
References: Kosmatka et al., Design and Control of Concrete Mixtures, 15th ed., Ch. 3 (heat of hydration, fineness and low-heat types); Newman & Choo, Advanced Concrete Technology 2, Ch. 2 (plastic and thermal cracking); Tokyay, Ch. 14.7 (mass concrete); ACI practice on mass concrete.
CEMENT / LAB 06 / BLENDED BINDERS
Stretch the clinker.
Slag, fly ash, silica fume and limestone replace part of the Portland cement. Design a binder, watch what each addition buys and costs, and try to satisfy a real brief at the lowest carbon.
Binder composition
Portland cement (clinker):
The clinker never drops below 20 % — the usual floor for a common cement; the sliders stop there.
Every bar is a share of the pure-OPC value (100 %); the amber line is the requirement of the active brief.
Design brief
- Why blend at all. Clinker carries roughly 0.85 t of CO₂ per tonne, nearly all of a binder's footprint: replacing it is the fastest way to cut concrete carbon. Slag and fly ash are industrial by-products, silica fume is a filter dust, and limestone only needs grinding.
- Each addition has a character. Slag hydrates latently — slow early, strong and dense later. Fly ash is pozzolanic: it consumes the calcium hydroxide the clinker releases, so it lives off the OPC share. Silica fume is ultra-fine and boosts 28-day strength in small doses. Limestone is a filler: cheap dilution, no cementing reaction. Calcined clay sits in the same family.
- The trade is always early strength against everything else. Heat, sulfate resistance, ASR mitigation and carbon all improve as the clinker share drops; one-day strength does not. Precast plants feel this first.
- These blends are standard products. CEM II (slag, ash or limestone) and CEM III (high slag) in EN 197-1; IS, IP and IT in ASTM C595 — the families from the cement-types lab are exactly this table.
Notes, model limits and references
What this lab models. Property indices are linear sums of per-material contributions (relative to pure OPC = 1) — a teaching approximation of the effects catalogued in PCA Ch. 4 and Tokyay Ch. 8–11, not a design method. Carbon factors are order-of-magnitude EPD figures (clinker 850, slag 80, fly ash 15, silica fume 30, limestone 30 kg CO₂ per tonne).
Limits. Real blends depend on slag/ash reactivity, fineness and chemistry, and on temperature and curing; sulfate and ASR performance also depend on the clinker's C₃A and alkalis, the water/binder ratio and the aggregate. The 20 % clinker floor is a common-cement convention, not a physical law.
References: Kosmatka et al., Design and Control of Concrete Mixtures, 15th ed., Ch. 2 (sustainability) and Ch. 4 (supplementary cementitious materials); Tokyay, Cement and Concrete Mineral Admixtures, Ch. 8–11 and 13; Calcined Clays for Sustainable Concrete for the calcined-clay family.
MATERIALS OF CONSTRUCTION / VIRTUAL LABORATORY
Liquid stone.
Engineered on site.
Concrete is designed twice: in the laboratory where the mix is proportioned, and on site where it is placed, compacted, cured and protected. Explore both sides, one experiment at a time.
Start exploringExplore the concrete labs
8 interactive experimentsWorkability & slump
Run the slump cone on different mixes: water, aggregate shape, size and admixtures against Shetty's workability table.
Interactive slump test 02 / FRESH CONCRETESegregation & bleeding
Watch water rise and grains settle: the bleed test and vibration stability of the fresh mix.
Interactive bleed & vibration bench 03 / DURABILITYAir content & freeze–thaw
Dose the agent, read the air on the pressure meter, then cycle a prism through 300 frosts.
Interactive meter & frost cabinet 04 / CURINGCuring & maturity
Cure a slab, log the maturity M = Σ(T + 11)×h and let Plowman's line decide when the forms come off.
Interactive curing station & maturity logger 05 / HARDENED CONCRETEStrength & specimens
Crush a cube, a cylinder and a 10 cm mould - then let IS 456's group-of-four rule judge the batch.
Interactive machine & acceptance desk 06 / IN-PLACE TESTINGNDT: rebound & UPV
Fire the Schmidt hammer and the PUNDIT at a member with a hidden defect - and learn what each can and cannot see.
Interactive hammer & pulse bench 07 / DURABILITYPermeability & durability
Pressurise the cell, run sixty years of carbonation - and learn why w/c and cover decide how long a structure lives.
Interactive cell & carbonation clock 08 / CAPSTONEMix design capstone
Take a job brief through IS 10262 end to end - grade, w/c, the tables, absolute volumes - and defend the sheet against the code, the slump cone and the 28-day cubes.
Interactive design officeCONCRETE / LAB 01 / FRESH CONCRETE
Does it flow?
Fresh concrete must be workable enough to place and compact, and no wetter than it needs to be. Build a mix, lift the slump cone and read what the mix is telling you.
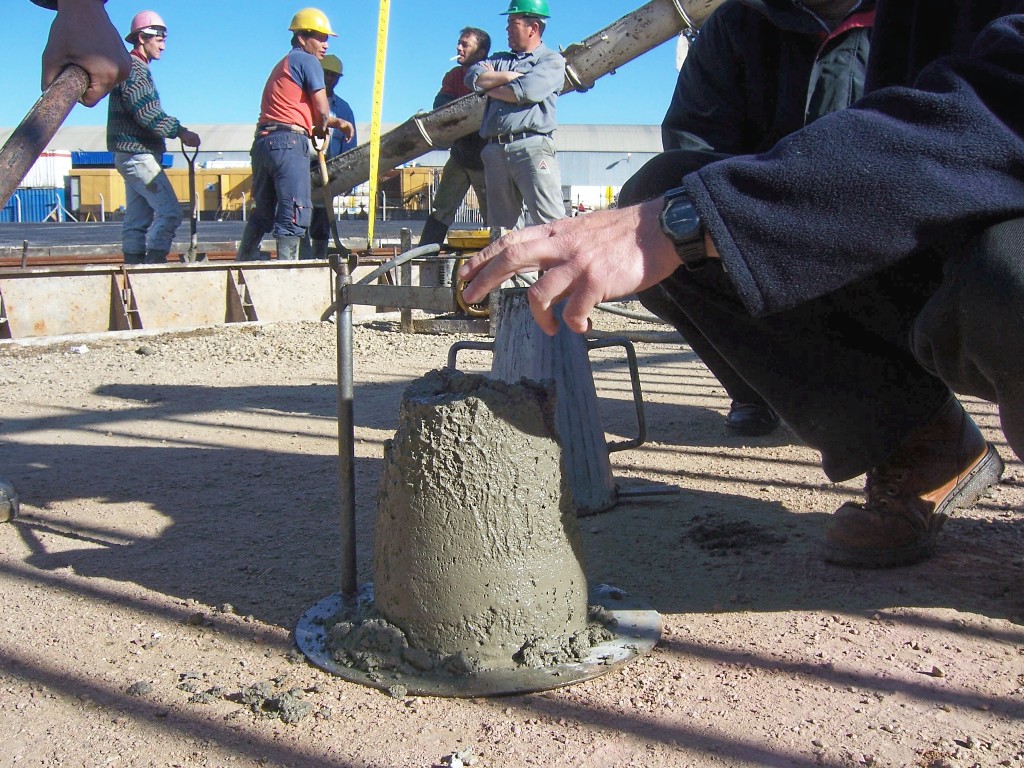
ASTM C143 / AASHTO T119 / EN 12350-2 Slump Cone
- Cone MoldFrustum geometry: 100 mm top × 200 mm base × 300 mm height with foot lugs and lifting handles.
- Tamping Rod16 mm (≈5/8 in) bullet-nosed steel rod: Hemispherical tip minimizes aggregate wedging and distributes consolidation.
- Three LayersEqual volume layering: Fill cone in 3 layers (roughly 65 mm, 155 mm, 300 mm deep), 25 strokes per layer with outer strokes tilted.
- Lift & ReadingVertical lift in 5 ± 2 s: Invert cone beside concrete, lay rod across the top, measure vertical subsidence to displaced center.
The mix
FROM THE CONE
Slump and consistence
The band follows the slump ranges of Shetty's Table 6.1: very low up to 25 mm (compacting factor 0.78-0.80), low to 50 mm (0.80-0.85), medium to 100 mm (0.85-0.92), high to 150 mm (0.92-0.95), and beyond that the flow table is the more suitable test. The w/c ratio is the number the strength and durability labs will come back to: 0.45 or less is dense, the 0.50-0.55 band is normal structural concrete, and every step above 0.60 starts to cost strength and life.
WHAT IT CAN GO IN
Placements this mix fits
Each row compares today's slump with the consistence that placement wants - Shetty's suitable uses for each workability degree. A mix can only sit in one band at a time, so earning one job usually costs you the others: that tension is what mix design resolves (lab 08).
WHY IT MATTERS
Workable, not wet
Workability is not one number: it is how easily a mix can be mixed, transported, placed and compacted without segregating or bleeding. The slump cone measures only consistence - the "wetness" - which is why the test is insensitive for stiff mixes and why a wet mix can look lovely and still shear and bleed. The cheapest fluidiser is water, but every kilogram extra raises the w/c ratio - the very quantity the strength and durability labs punish. Water reducers buy back the slump without the water: that is why a modern 0.45 w/c mix can still pump at 120 mm of slump.
Notes, model limits and references
What this lab models. Slump grows about 5 mm per kg/m³ of water above the mix's water demand (the PCA rule of thumb: +5 kg/m³ of water gives about +25 mm of slump), with the demand set by particle shape and coarse size (rounded 154, crushed 174, flaky 188 kg/m³ at 20 mm). Admixture gains saturate with dose and need a workable base mix (Shetty: 20-30 mm of reference slump before a superplasticizer can fluidise).
Limits. The cone measures consistence, not workability; the rule of thumb fails for very stiff or very wet mixes. The admixture curves are teaching shapes between Shetty's numbers (30-150 mm gain at 0.1-0.4 % plasticizer; a 75 mm mix pushed past 230 mm by a superplasticizer) and PCA's water reductions (normal 5-10 %, mid-range 6-12 %, high-range 12-40 %). Real admixtures are cement-specific and need trial batches and slump-loss checks on site.
References: Shetty, Concrete Technology, workability chapter (Table 6.1, slump and compacting factor tests) and the admixtures chapter; Kosmatka et al., Design and Control of Concrete Mixtures, 15th ed., Ch. 6, 7 and 9 (water demand and aggregate size, water reducers, fresh concrete); ASTM C143; IS 456 degrees of workability.
MATHEMATICS & GOVERNING EQUATIONS
Consistence, Water Demand & Compacting Factor
Free Water-to-Cement Ratio
Controls paste capillary porosity and ultimate compressive strength per Abrams' Law.
Wfree: mixing water (kg/m³) · C: cement content (fixed 350 kg/m³ in this bench)
Water-Slump Sensitivity
PCA rule of thumb: adding +5 kg/m³ of water increases slump by approximately +25 mm.
Valid within normal consistence bands; stiff and shearing mixes depart non-linearly.
Compacting Factor Relation
Better suited for very low slump mixes (0–25 mm) where the slump cone is insensitive.
Normal structural range: 0.85–0.92 · Pavement PQC: 0.75–0.80 · Tremie: >0.95
Admixture Water Reduction
Superplasticizers (PCE) reduce water by 20–35% while maintaining fluid placement.
Permits low w/c ≤ 0.40 high-durability concrete to pump without segregation.
Field Case Study: The "Water at the Chute" Trap
Forensic Engineering LessonOn a commercial basement project in Mumbai, ready-mix transit mixers experienced unexpected 45-minute traffic delays in 34°C heat. Upon arrival, the mix slump had dropped from 120 mm to 40 mm due to early hydration and moisture loss. Instead of dosing redosing superplasticizer under QA supervision, the site crew added 35 liters of water directly into the truck drum chute to make the concrete pumpable.
⚒ Student Laboratory Challenges & Self-Check Missions
Mission 1: The Pumpable High-Strength Dilemma
Can you produce a mix with at least 120 mm slump while strictly maintaining w/c ≤ 0.45 without causing shear failure?
Mission 2: Aggregate Geometry & Water Penalty
Compare flaky aggregate against rounded gravel at identical 175 kg/m³ water. How much slump do the elongated/flaky particles cost you?
Mission 3: The Bone-Dry Admixture Threshold
Set mixing water to 140 kg/m³ and dose superplasticizer to maximum 1.5%. Why does the slump refuse to lift off zero?
CONCRETE / LAB 02 / FRESH CONCRETE
Keep it together.
A good mix stays homogeneous from the mixer to the mould. Stand a sample and pipette the bleed water, then over-vibrate the same mix and watch what separates.
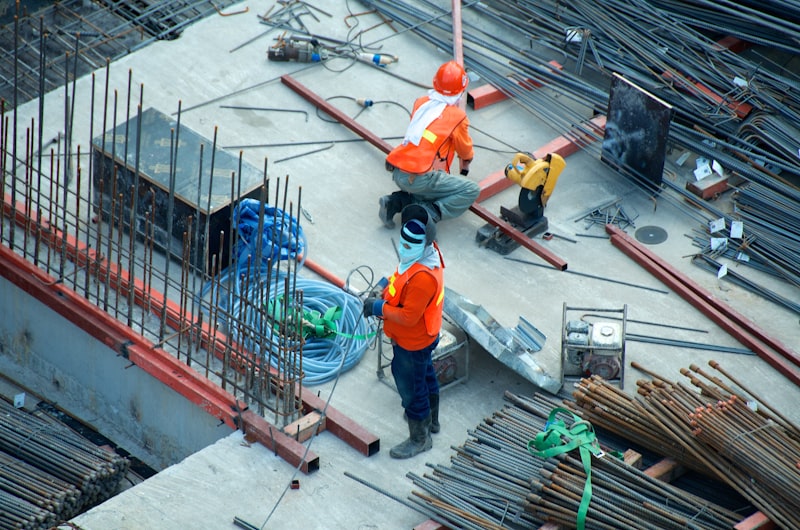
ASTM C232 / ACI 309R Bleed Cylinder & Internal Poker Vibrator
- Test Container14 L Cylindrical Mold: 250 mm diameter × 280 mm height rigid steel cylinder filled in 3 compacted layers.
- Extraction PipetteCapillary syringe / pipette: Aspirates accumulated surface bleed water at regular intervals without disturbing the mortar skin.
- Internal PokerHigh-frequency needle vibrator: 10,000–12,000 vpm rotating eccentric mass; essential to consolidate stiff mixes but dangerous when prolonged.
- Burette ReadingGraduated cylinder: Accurately measures total accumulated bleed volume (mL) converted to percentage of initial batch mixing water.
The mix
FROM THE TWO RUNS
Bleeding, Settlement & Segregation
THE HOMOGENEITY CHECKS
What the two runs decide
Physical Mechanism: Stokes' Law, Rebar Voids & Laitance
Stokes' Sedimentation & Top-Bar Effect: Bleeding is driven by gravity as aggregate particles sink in the fluid paste. Upward displaced water accumulates under horizontal rebar, creating water lenses that leave void spaces after drying, cutting steel-concrete bond by up to 35-50% (the basis of the ACI 318 top-bar factor).
Finishing Trap: Premature troweling seals the surface skin while bleed water continues rising beneath, resulting in blister delaminations and weak, dusty laitance ("dust in dry seasons, slush in wet").
Notes, model limits and references
What this lab models. Bleeding grows past w/c 0.40 and is scaled by the sand fines and the cohesion aid, capped at 12 % of the mixing water (Shetty's mortar example spans 7.5-15 %). The vibration separation grows with vibration time and w/c and eases with fines and air. Settlement is computed, not fudged: the bleed volume divided by the cylinder area.
Limits. Real bleeding depends on cement fineness and chemistry, mix height and pressure (PCA), temperature and evaporation; the water layer in the drawing is exaggerated three times so it can be seen. Shetty: segregation "is difficult to measure quantitatively" - the index is a teaching scale, and the golden rule is to judge and adjust mixes by eye and by trial, not by one number.
References: Shetty, Concrete Technology, segregation and bleeding sections (water gain, laitance, the 0.70 w/c channel rule, the IS 1199 bleeding test, over-vibration warnings, air-entrainment effects after Wuerpel); Kosmatka et al., Design and Control of Concrete Mixtures, 15th ed., Ch. 4 (fines, fly ash and slag effects on bleeding) and Ch. 9 (bleeding and settlement, uniform vs. channel bleeding, settlement shrinkage); ASTM C232 / AASHTO T 158.
MATHEMATICS & GOVERNING EQUATIONS
Bleeding Rate, Settlement & Stokes' Sedimentation
Bleeding Capacity
Total volume of bleed water expressed as a percentage of initial batch net mixing water.
Vw: collected bleed volume (mL) · V0: sample volume · w: water mass fraction
Plastic Settlement Shrinkage
Vertical drop of the concrete surface as bleed water evacuates and aggregates pack downwards.
4.8% bleed on 189 kg/m³ mix produces ≈1.8 mm subsidence over a 250 mm deep lift.
Particle Sedimentation Rate
Stokes' Law governs aggregate settlement velocity through fresh cement paste matrix.
v: velocity · r: particle radius · ρs, ρf: densities · η: paste dynamic viscosity
Bleed Rate per Unit Area
Rate of water bleeding per unit surface area per unit time (ASTM C232).
If evaporation rate E > Rb, surface desiccates rapidly, initiating plastic shrinkage cracking.
Field Case Study: Warehouse Floor Delamination & Debonding
Forensic Engineering LessonA 12,000 m² logistics warehouse floor in Dubai suffered severe hollow-sounding delamination across 40% of its surface just 3 months after commissioning. Heavy reach-stacker forklift traffic broke through the top 4 mm wear layer, creating hazardous tire-snagging pits. Core samples showed a dense 3 mm polished mortar cap separated from the main slab by a continuous horizontal microscopic fissure.
⚒ Student Laboratory Challenges & Self-Check Missions
Mission 1: The Bleed Runaway
Set mixing water to 250 kg/m³ and sand fines to 0%. Run the bleeding test. What happens to the bleed water and settlement?
Mission 2: Fighting Bleed with Mineral Admixtures
Keep mixing water at 220 kg/m³, but increase sand fines to 15% and select Fly ash as the cohesion aid. What changes?
Mission 3: The Over-Vibration Danger
Run the poker vibrator for 90 seconds on a wet mix (w/c > 0.60). How does this affect the segregation index?
CONCRETE / LAB 03 / DURABILITY
Bubbles with a job.
Entrained air is the cheapest durability concrete ever bought: microscopic bubbles that let freezing water expand without tearing the paste. Dose the agent, read the air on the pressure meter, then send a prism through 300 frost cycles and see what the number buys.
LABORATORY APPARATUS
The ASTM C231 Type B pressure air meter
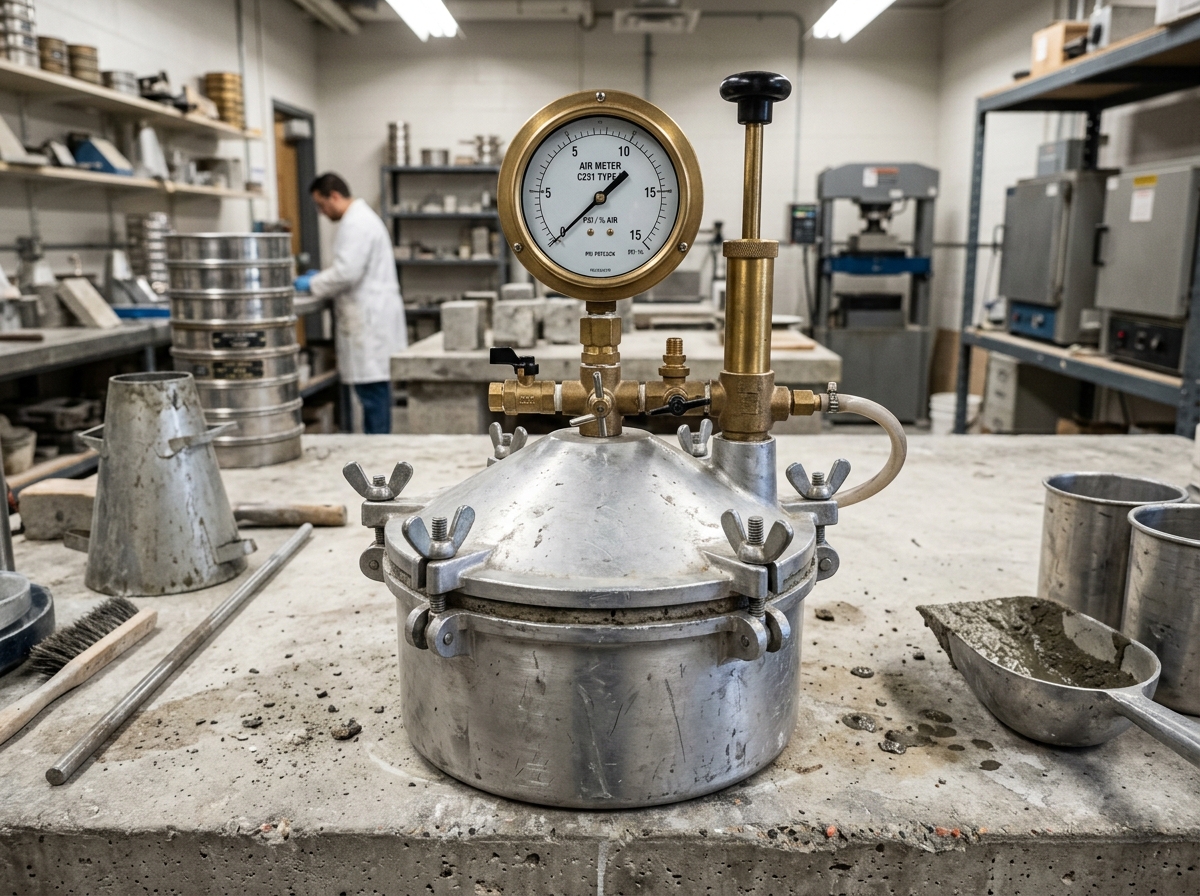
What you are looking at in the lab ASTM C231 / AASHTO T152
- GaugeCalibrated Pressure Gauge: Marked directly in air void percentage (0–10%). Operates by Boyle's Law (P₁V₁ = P₂V₂) as compressed air in the chamber expands into the bowl.
- ValvesPetcock Bleeder Valves: Twin brass valves used to inject water with a syringe until all trapped air bubbles above the struck-off concrete surface escape.
- Lid & ClampsConical Cover & Toggle Clamps: Cast aluminum lid clamped airtight with a rubber gasket over the 7.0 L measuring bowl.
- PumpIntegral Air Pump: Pressurizes the upper chamber to an initial calibration mark before opening the main needle valve.
2. Tap sides 10–15 times with a mallet to close rod holes, then strike off flush with the strike-off bar.
3. Clamp cover, inject water through one petcock until water flows bubble-free from the other.
4. Pump air chamber to initial pressure line, open main valve, tap gauge lightly, and read air % directly.
The mix
FROM THE TWO RUNS
Air System & Freeze-Thaw Indices
WHAT THE TWO RUNS DECIDE
The air-void system check
Physical Mechanism: Powers' Hydraulic Pressure & Spacing Factor
The 9% Volume Hydraulic Jack: Freezing water expands by 9.05% in volume. Without nearby air-void relief reservoirs within L ≤ 0.20 mm, expelled capillary water creates hydraulic pressures exceeding 3.0 MPa, shattering the hardened C-S-H paste from the inside out.
Entrained vs Entrapped: Microscopic entrained bubbles (5-80 µm) provide dense relief reservoirs. Large entrapped voids (10-1000 µm) are too far apart to protect the paste and only reduce strength.
Notes, model limits and references
What this lab models. The dose curve saturates like every admixture (compare lab 01), hot concrete foams less (PCA: air content falls as temperature rises), and placement loses air on Shetty's curve - gentle for good consolidation, about 50 % gone by 2.5 minutes of vibration and 80 % by 9. The spacing factor follows Powers' equation L = 3/α·(1.4·(P/A)1/3 − 1) with the specific surface α interpolated between an entrapped and an entrained system; the frost result scales the failure cycle with (0.200/L)² and quotes the relative dynamic modulus at 300 cycles.
Limits. Real air content depends on the agent chemistry, the sand grading, mixing time, the alkali content of the cement and more (Shetty); the pressure meter itself must be corrected for the air trapped in aggregate pores (PCA). The C457 parameters come from a microscope on hardened concrete, not from this bench; the durability factor is a teaching curve through Cordon's < 20 % poor / > 80 % good brackets, not a C666 prediction for a specific mix.
References: Shetty, Concrete Technology, admixtures chapter (entrained vs entrapped sizes, factors affecting entrainment, Table 5.12 recommended air, Figs. 5.19-5.24 durability and strength, the pressure / volumetric / gravimetric methods); Kosmatka et al., Design and Control of Concrete Mixtures, 15th ed., Ch. 11 (air-void parameters, Cordon's durability factor, deicer scaling) and Ch. 18 (C231, C173, C457 and C666 test descriptions); ASTM C231, C173, C457, C666.
MATHEMATICS & GOVERNING EQUATIONS
Boyle's Law, Powers Spacing Factor & Frost Durability
Boyle's Law Pressure Air Meter
Relates pressure drop from the pre-pressurized air chamber into the bowl to air void volume.
Water is incompressible; only air void pockets contract under the 100 kPa applied pressure.
Powers Air Void Spacing Factor
Maximum distance water must travel through capillary paste to reach an expansive relief bubble.
α: specific surface of voids · p: paste volume fraction · A: air void volume fraction
ASTM C666 Durability Factor
Quantifies resistance to 300 rapid freezing-and-thawing cycles (+4°C to −18°C).
P: relative dynamic modulus % · N: cycles to failure (or 300) · M: 300 cycles · DF ≥ 80% is durable
Strength Reduction Rule
Road Research Laboratory rule: every 1% entrained air reduces 28-day compressive strength by ~5.5%.
Air bubbles act like zero-strength aggregate particles, requiring w/c adjustments to compensate.
Field Case Study: Winter Highway Scaling & The Over-Vibration Trap
Forensic Engineering LessonA newly paved 18 km interstate concrete highway in Wisconsin suffered severe surface scaling, pop-outs, and "D-cracking" during its very first winter. Pavement slabs deteriorated into loose gravel along longitudinal joints. Batch plant QA tickets proved that concrete left the plant with 6.2% entrained air, fully meeting DOT specifications.
⚒ Student Laboratory Challenges & Self-Check Missions
Mission 1: The Frost Defense Threshold
Find the minimum AEA dose required to keep the ASTM C457 spacing factor below the critical 0.200 mm limit.
Mission 2: Temperature Sensitivity of Air Entrainment
Set AEA dose to 250 mL/m³ and compare the resulting air content at 10°C vs 35°C. Why does hot weather kill bubbles?
Mission 3: The Danger of Air Over-Dosing
Max out the AEA dose to 400 mL/m³ with minimal vibration. What happens to the concrete's compressive strength?
CONCRETE / LAB 04 / CURING
Give it time.
Strength is bought with water and warmth, and the receipt is written in degree-hours. Keep a specimen wet - or abandon it to the air - then run the maturity meter, walk Plowman's line and find the day the forms can come off.
LABORATORY APPARATUS
Curing tanks & digital maturity loggers
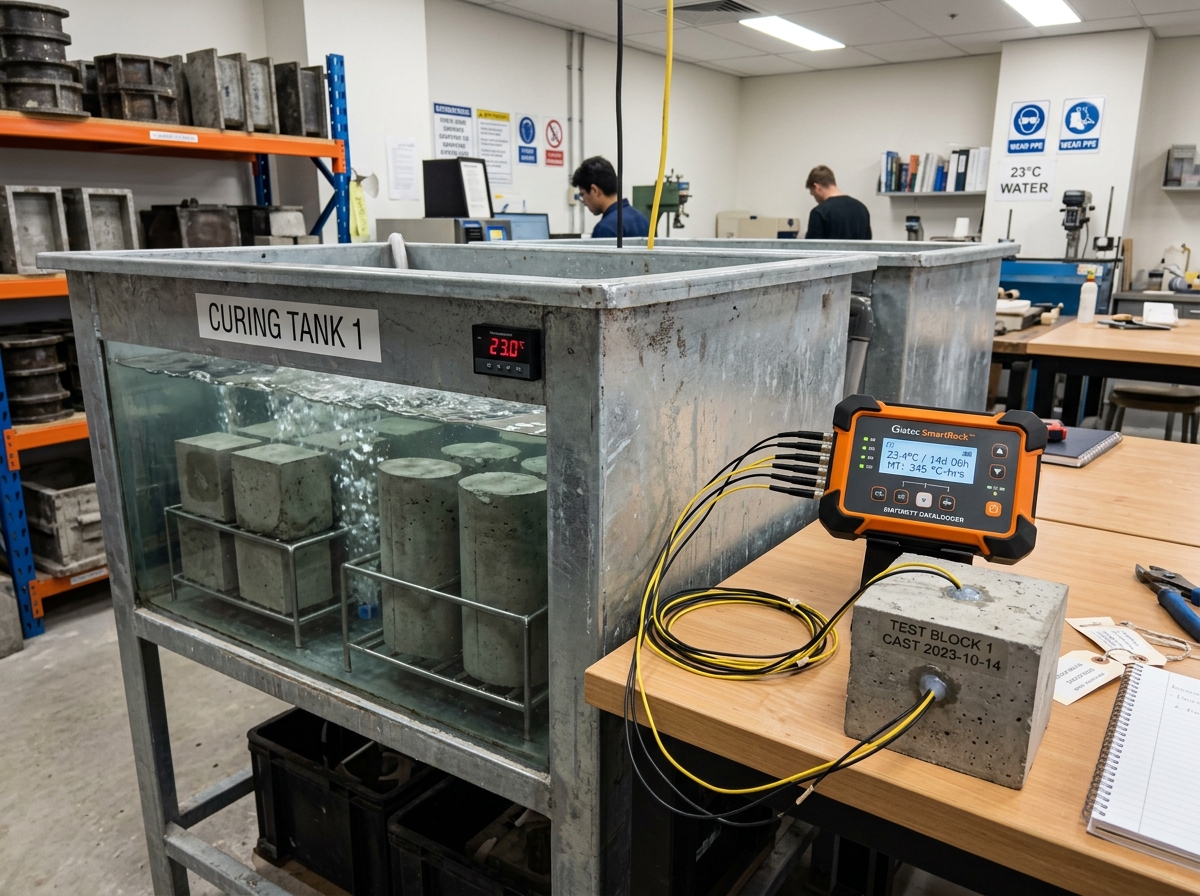
What you are looking at in the lab ASTM C511 / C1074 / ACI 308R
- Water TankThermostatic Curing Tank: Maintains continuous 100% relative humidity and lime-saturated water (3 g/L Ca(OH)₂) to prevent leaching of hydration products from test specimens.
- RacksSubmersion Grid: Elevates specimens off the tank floor so water circulates freely around all six faces of standard cubes and cylinders.
- SensorSacrificial Thermocouple Wire: Embedded directly into critical structural sections (or mid-depth of slabs) during casting to record actual hydration heat and ambient history.
- LoggerMaturity Datalogger: Continuously computes the Nurse-Saul maturity index M = ∑(T − T₀)·Δt, predicting real-time in-place strength gain.
The site
FROM THE TWO RUNS
Strength Gain & Stripping Readiness
WHAT THE TWO RUNS DECIDE
The curing check
Physical Mechanism: Nurse-Saul Maturity & The Skyline Plaza Disaster
The Skyline Plaza Collapse (1973): Stripping shores from young concrete in cool weather led to a catastrophic punching-shear failure at column heads, triggering progressive multi-story collapse. Concrete requires ≥ 70% compressive strength before shores can be safely removed.
Capillary Segment Closure: Cement gel expands 2.1× the volume of unhydrated cement. At w/c 0.45, moist curing for 7 days segments continuous capillary pores into discontinuous gel pores, reducing permeability by orders of magnitude.
Notes, model limits and references
What this lab models. Maturity is Shetty's: M = Σ(T + 11) × hours, fully matured at 19,800 °C·h = 28 days at 18 °C, strength % = 32 + 54 × log₁₀(M/1000) from Plowman's Table 7.5 for the 35.0-52.5 MPa zone (a 40 MPa mix). At 20 °C a specimen banks 744 °C·h per day; moist curing runs at full rate, a membrane at 85 %, exposure to air at 28 %, and the one-day steam cycle at 60 °C counts double the linear value because the time-temperature factor undercounts high temperatures (PCA) - all stated teaching assumptions. Once curing stops, the model keeps only a quarter of the rate: drying slows hydration everywhere except the still-sealed interior.
Limits. Real sites vary temperature hour by hour (the lab uses a mean), and the maturity method needs a calibration curve for the exact mix before any number from it is trusted (ACI 306R, C1074). Plowman's line is a fit over four strength zones - good inside its range, and this lab caps it at 100 %. The steam cycle is compressed to a day for teaching; real cycles ramp at 10-20 °C/h and hold 60 °C for 6-12 h (PCA).
References: Shetty, Concrete Technology, strength chapter (maturity concept, the −11 °C datum, Plowman's coefficients Table 7.5, the two worked examples) and the curing and concreting-in-cold-weather sections; Kosmatka et al., Design and Control of Concrete Mixtures, 15th ed., Ch. 15 (curing methods, the ACI 301 seven-day rule, the steam cycle, curing temperature against 28-day strength) and Ch. 11 (Powers' Table 11-1, capillary discontinuity and permeability), Ch. 17 (cold weather, 70 % for stripping, practical maturity); ASTM C1074; ACI 301 and 306R.
MATHEMATICS & GOVERNING EQUATIONS
Nurse-Saul Maturity, Plowman Logarithm & Stripping Threshold
Nurse-Saul Maturity Index
Cumulative thermal history in °C·hours quantifying extent of hydration.
Ta: concrete temperature · T0: datum temperature (−11°C per Plowman / ASTM C1074) · Δt: hours
Plowman's Strength Function
Predicts percentage of 28-day standard strength as a logarithmic function of maturity.
For 35–52 MPa concrete: A = 32%, B = 54% · Fully matured reference: 19,800 °C·h
Powers Hydration Degree Limit
Pores run out of capillary water without external moist curing (self-desiccation).
At w/c ≥ 0.42, 100% hydration (α = 1.0) is possible provided moisture is maintained.
Safe Stripping Criterion
Formwork removal requirement: in-place strength must resist construction dead and live loads.
Slabs & beams require ≥70% strength before props and vertical shores can be safely struck.
Field Case Study: The Skyline Plaza Disaster (Bailey's Crossroads, VA, 1973)
Forensic Engineering LessonDuring construction of the 26-story Skyline Plaza residential tower, formwork shoring was prematurely stripped from the 24th floor slab. Ambient temperatures had hovered between 4°C and 7°C during the preceding 4 days. While site schedules assumed a standard 7-day strength gain, cold temperatures had severely retarded cement hydration.
⚒ Student Laboratory Challenges & Self-Check Missions
Mission 1: Cold Weather Formwork Stripping Delay
Compare the days required to reach the 70% safe stripping strength at 5°C vs 25°C for water-cured concrete.
Mission 2: Air-Dried Desiccation Penalty
Switch curing method from Water bath to Air dry at 28 days. What happens to relative strength and paste density?
Mission 3: High-Temperature Precast Acceleration
Select Steam curing at 40°C for 3 days. Can the forms come off in under 48 hours?
CONCRETE / LAB 05 / HARDENED CONCRETE
Break it properly.
Every strength number is a measurement, not a truth: the mould, the ends and the statistics all get a vote. Crush a specimen in the machine, then sample a batch and apply the code that decides whether the concrete is accepted.
LABORATORY APPARATUS
Hydraulic compression testing machine & moulds
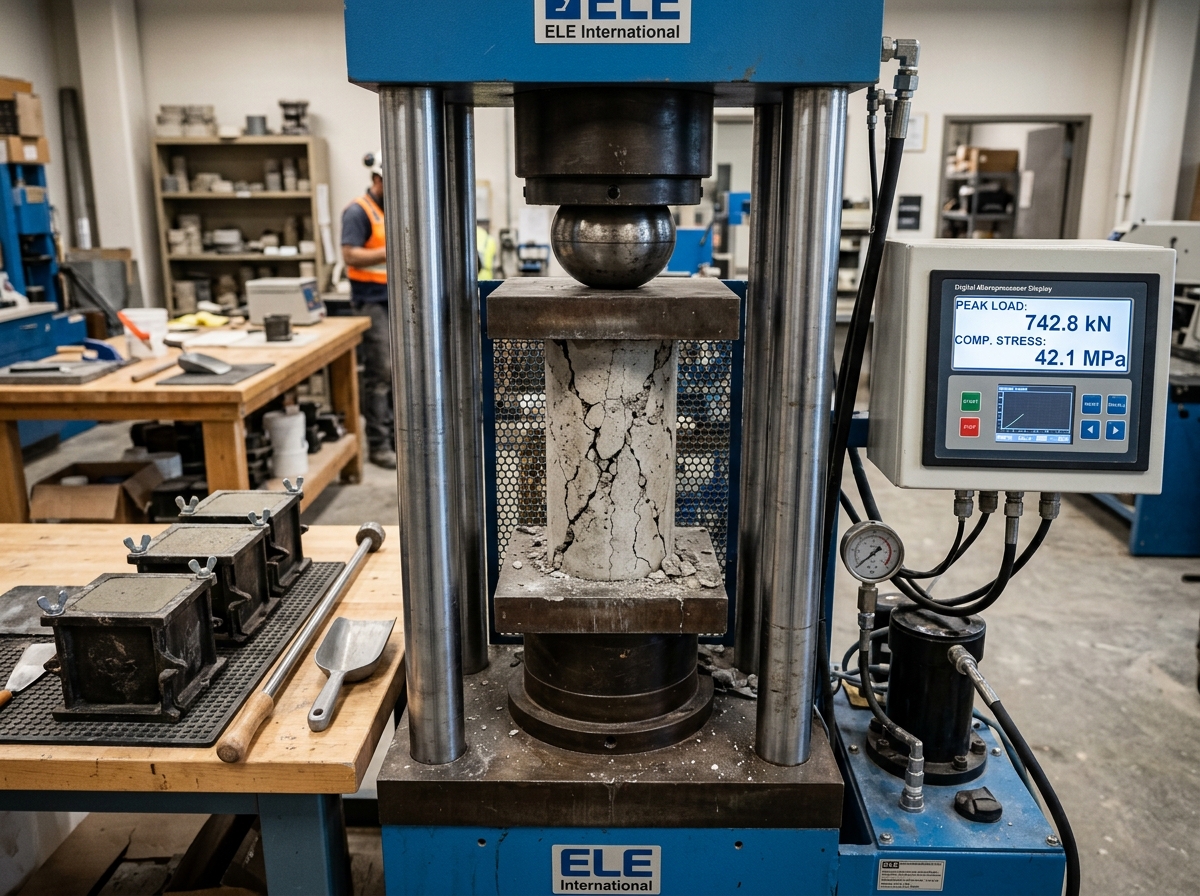
What you are looking at in the lab ASTM C39 / EN 12390
- PlatenSpherical Seated Upper Platen: Mounted in a ball-and-socket joint that freely tilts initially to seat uniformly against non-parallel specimen surfaces, then locks under load to prevent bending stresses.
- ReadoutMicroprocessor Load Console: Digital display providing real-time load (P in kN), stress rate pace bar (0.15–0.35 MPa/s), and automatic peak hold upon fracture.
- SpecimenFractured Cylinder / Cube: Demonstrates classic conical hourglass shear fracture along failure planes at ≈ 60° to the horizontal.
- MouldsHeavy Cast Steel Moulds: Machined to strict interior planeness (< 0.03 mm) with bolted baseplates and wingnuts to ensure dimensional precision during casting.
The job
FROM THE TWO RUNS
Strength Indices & Batch Acceptance
WHAT THE TWO RUNS DECIDE
The testing check
Physical Mechanism: Platen Friction Cones & Specimen Aspect Ratio
Platen Confinement & Hourglass Fracture: Steel platen friction restrains lateral Poisson expansion of concrete ends, creating triaxial compression cones. In cubes (h/d = 1.0), cones overlap completely, boosting apparent strength by ~15-25%. In cylinders (h/d = 2.0), the central gauge length is in true uniaxial compression, failing in clean 58° diagonal shear.
Statistical Acceptance (IS 456): Concrete is accepted on the statistics of the batch (mean of 4 consecutive ≥ f_ck + 0.825s, no sample < f_ck - 4), never on a single lucky cube.
Notes, model limits and references
What this lab models. Abrams' law with Shetty's 28-day constants: S = 14,000 psi × 7−w/c (96.5 MPa at the origin strength), so w/c 0.45 gives 40.2 MPa. The 10 cm cube reads 10 % high (reduce the reading by 10 % - Shetty); the cylinder/cube ratio follows his Table 10.1 (0.77 at 9 MPa rising to 0.94 near 37 MPa, approaching 1.00 at 100 MPa); unprepared ends cost about 15 % (a teaching estimate - Shetty notes only that capping affects the result). The sampling: six samples of three cubes drawn from the mix mean with the site standard deviation; a sample is rejected when its trio spreads more than 15 % of its average; acceptance uses IS 456 Table 11.29 for M 20 and above.
Limits. Real cube results carry material and testing noise far beyond this clean simulation, and IS 456 wants the standard deviation from 30+ site records rather than from six samples - the s selector stands in for those records. The loading rate, platen friction, moisture condition of the specimen and machine stiffness all move the reading a few per cent; the lab fixes them so the mould and the statistics can carry the lesson.
References: Shetty, Concrete Technology, strength and testing chapters (Abrams' law and its constants, Table 10.1 cube/cylinder strengths, the 10 cm cube -10 %, capping and end restraint, statistical quality control, IS 456 Tables 11.22, 11.28 and 11.29); Kosmatka et al., Design and Control of Concrete Mixtures, 15th ed., Ch. 18 (specimens, C39/C617, acceptance) and Ch. 12 (Abrams and the w/cm curve); ASTM C39, C617; IS 516; IS 456:2000 Tables 11 and 15.
GOVERNING PRINCIPLES & DERIVATIONS
Compressive Strength Mechanics, Specimen Geometry & Acceptance Statistics
Abrams' Law
Higher water/cement ratio expands capillary porosity, exponentially reducing compressive strength.
A = 96.5 MPa (14,000 psi) and B = 7.0 are empirical constants for 28-day standard cured strength.
Geometry & Triaxial Confinement
Steel platen friction restrains lateral expansion at specimen ends, producing multiaxial compressive cones.
150 mm cube (h/d = 1.0) has full overlapping restraint; 150 × 300 mm cylinder (h/d = 2.0) has pure uniaxial midsection.
Target Mean Strength (IS 456 / ACI 214)
Guarantees 95% statistical confidence that in-situ tests exceed characteristic strength fck.
As site standard deviation s climbs from 3.5 to 7.0 MPa, required target mean surges by ~6 MPa.
IS 456 Table 11 Acceptance Rule
Any batch is rejected if four-sample averages fall below threshold or any specimen is >3 MPa under fck.
Within any 3-cube sample, if range exceeds 15% of the average, the sample is discarded as invalid.
The 2008 South Padre Island Ocean Tower Demolition (Texas, USA)
During construction of the 31-story luxury beachfront high-rise Ocean Tower, differential settlement and severe column buckling were detected when construction reached the 28th floor. Columns and shear cores in the lower parking garage levels began crushing under their own dead load, developing extensive spalling and diagonal shear fractures.
⚒ Student Laboratory Challenges & Self-Check Missions
Mission 1: The w/c Strength Cliff
Set w/c to 0.35, then slide it up to 0.60 for a 150 mm cube. What is the loss in compressive crushing load?
Mission 2: Cube vs. Cylinder Discrepancy
Compare crushing failure between a 150 mm cube and a 150 × 300 mm cylinder at w/c = 0.45. Which carries more load?
Mission 3: High Standard Deviation Site Rejection
Switch site standard deviation from s = 3.5 MPa (good control) to s = 7.0 MPa (poor control) on an M 30 mix. What happens to compliance?
CONCRETE / LAB 06 / IN-PLACE TESTING
Listen to the wall.
No cube can be cut from a finished column, yet the report still wants a number. Fire the Schmidt hammer at the surface, run the pulse through the section - and find the defects that neither method can see alone.
LABORATORY APPARATUS
Non-destructive testing: Schmidt hammer & UPV tester
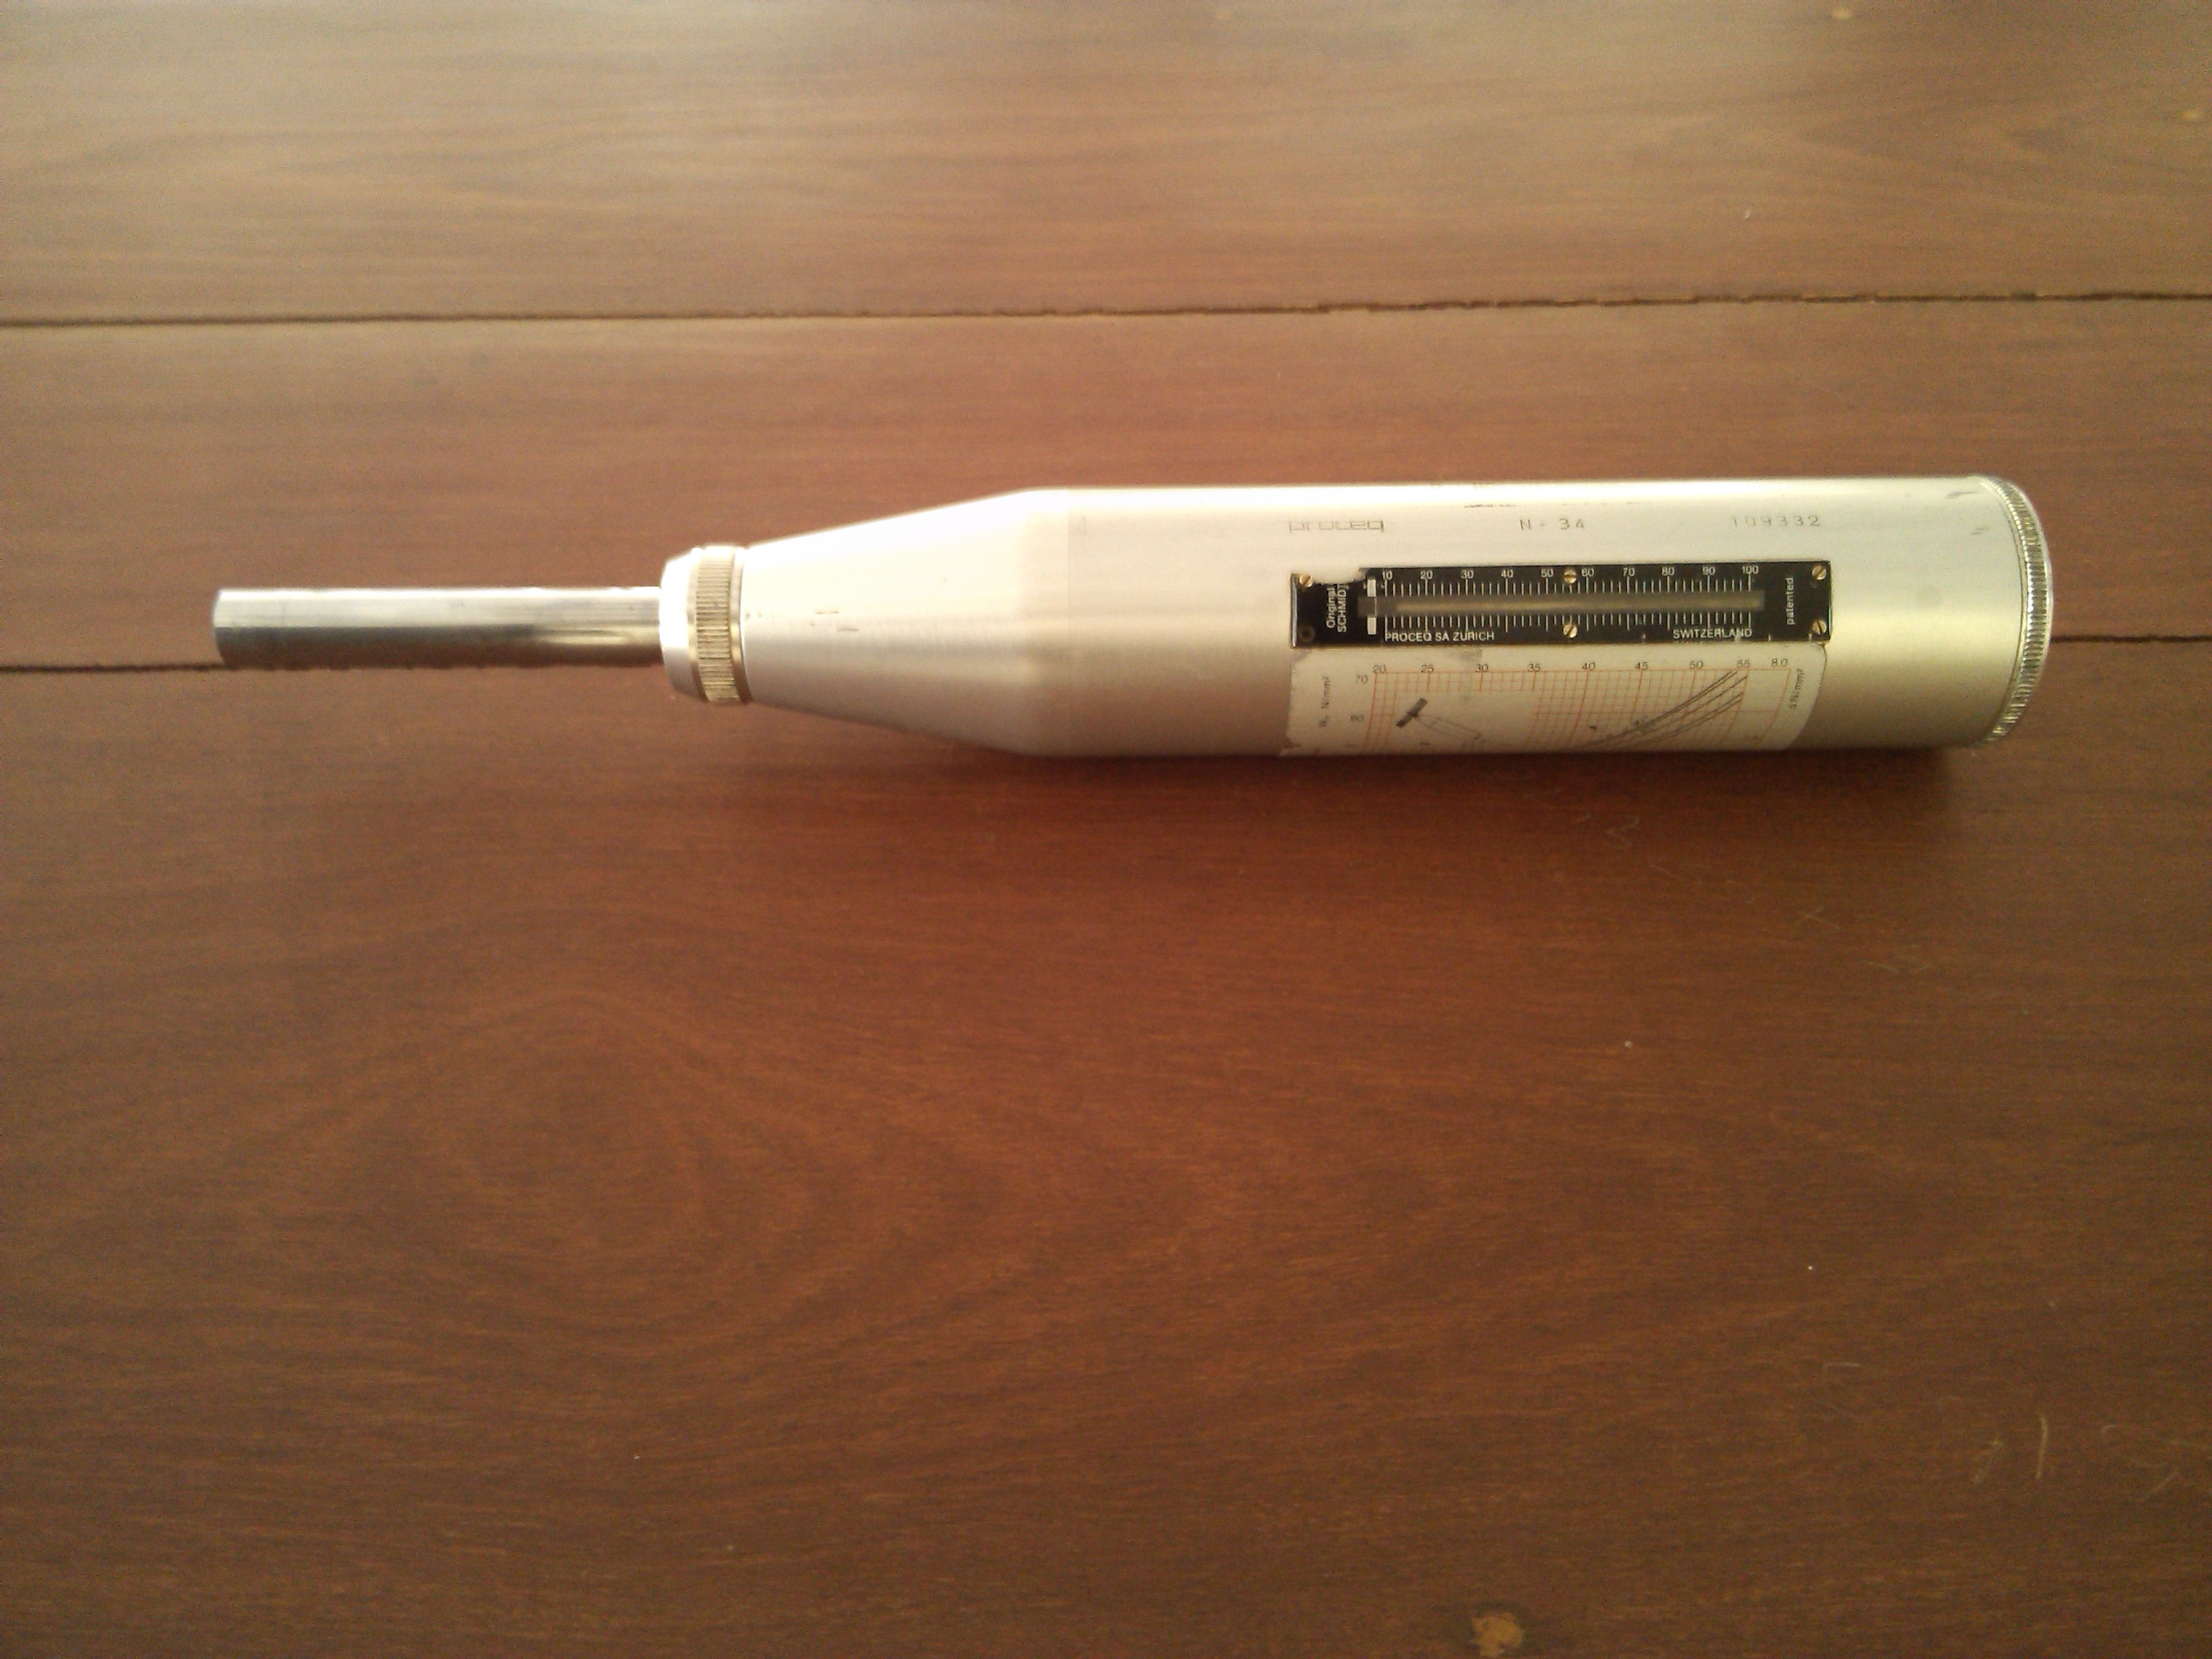
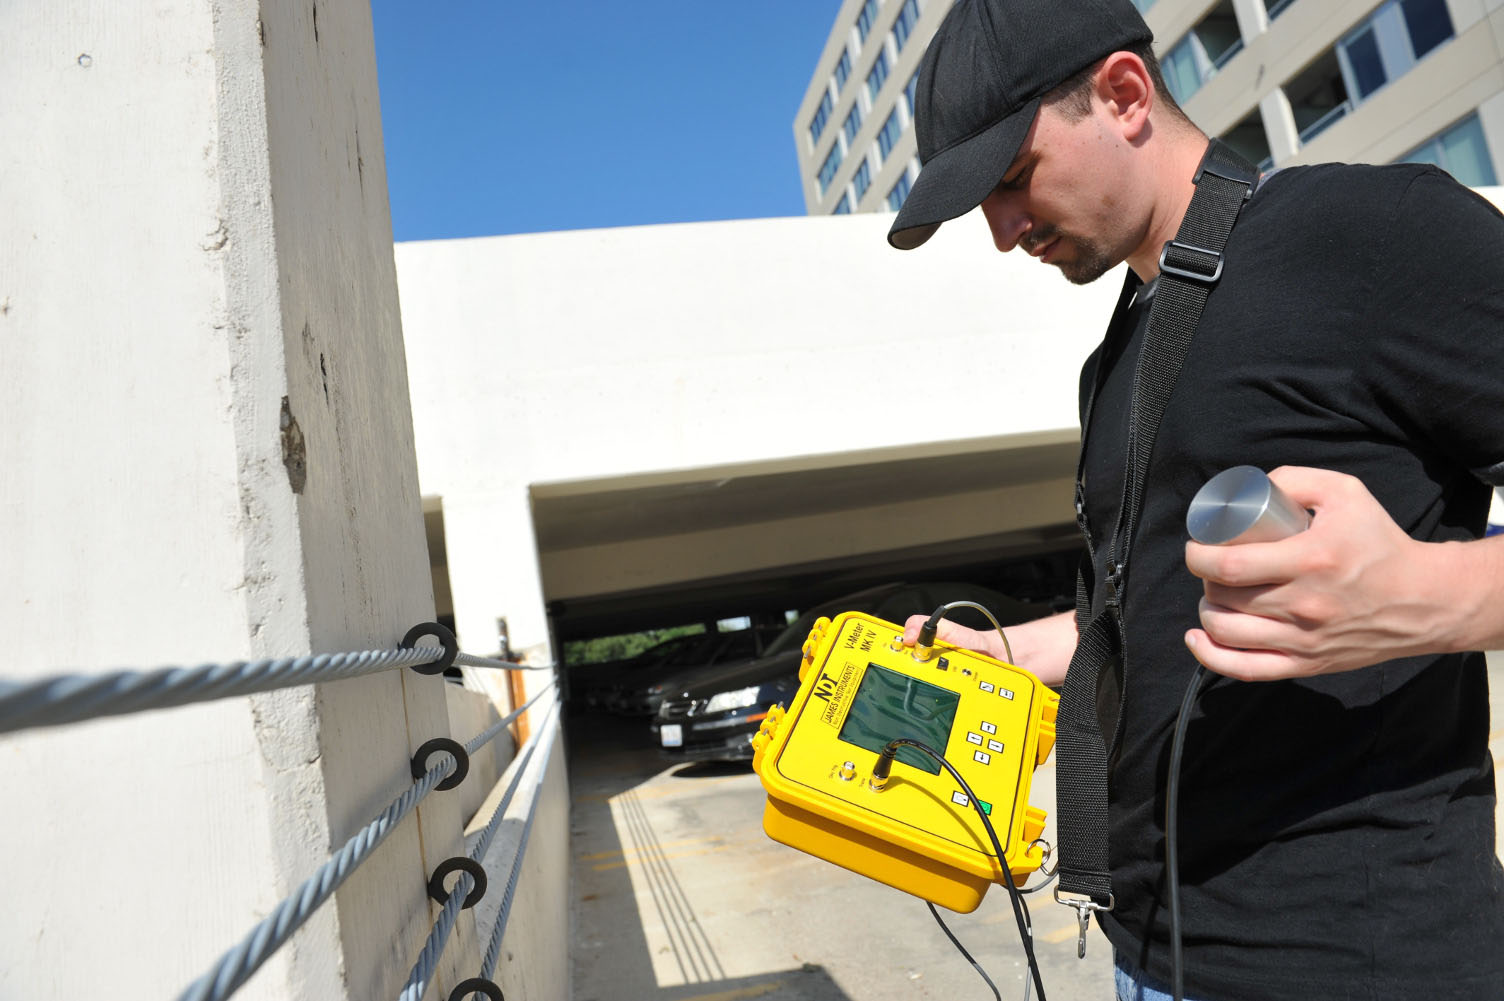
What you are looking at in the field ASTM C805 / C597 / EN 12504
- Plunger & SpringRebound Hammer (Surface Skin): Impact energy (2.207 Nm) releases a hammer mass against the plunger. The rebound distance (R) reflects the surface hardness of the outer 25–30 mm mortar layer.
- CarborundumSurface Grinding Stone: Crucial to remove loose laitance, paint, or carbonation (which artificially inflates R by up to 50%) prior to testing.
- TransducersUPV Direct Transmission: Transmitter sends high-frequency compressional waves; receiver detects arrival through acoustic couplant. Transit velocity V = L / t reveals concrete compactness and internal defects across the entire thickness.
- Combined MethodWhy Combine Both (SONREB Method): Moisture increases pulse velocity but lowers rebound number; carbonation raises rebound number but has minor effect on pulse velocity. Combining both cancels individual errors.
The survey
FROM THE TWO RUNS
The in-place estimate
The rebound number carries the whole personality of the method: it shifts with surface finish, moisture, carbonation and impact direction, so every site needs its own calibration on cores - a calibrated hammer still carries only ± 15-20 % (Shetty). The pulse velocity is the opposite animal: no strength can be read from it without a calibration either, but it does not care about the skin - it averages the entire path, which is exactly what finds voids and cracks, and why saturation (+2 %) and reinforcing steel (1.2-1.9× the velocity of concrete) must be kept out of the reading.
WHAT THE TWO RUNS DECIDE
The survey check
Four questions, in the order a survey answers them: was the hammer fired on a surface that deserves it; can the calibration carry the estimate; does the velocity speak for sound concrete through the whole path; and do the two methods agree before anybody signs the report. Shetty's conclusion still holds: neither method is reliable alone - "the most popular combination was the ultrasonic pulse velocity method in conjunction with ... the rebound hammer".
WHY IT MATTERS
What the hammer cannot see
The rebound hammer is a hardness tester: it feels the outer few millimetres, where carbonation, a trowelled skin or a wet surface can move the number more than the concrete does. A honeycomb pocket fifty millimetres deep or a crack crossing the section is invisible to it - and that is exactly the defect that eats a structure. The ultrasonic pulse sneaks past the skin: it averages the whole path, so voids and cracks show up as lost velocity, moisture and steel as gained velocity, and nothing at all about strength unless a site-specific curve exists. Put the two together and the survey becomes an instrument of suspicion: where the hammer says "sound" and the pulse says "something is in the way", you have found a hidden defect - and the next tool is a grid of readings and a drill, not a signature.
Notes, model limits and references
What this lab models. The member's true strength comes from the same Abrams curve as the strength lab (96.5 x 7−w/c). The site calibration maps R to strength through 9.5 + 4.7√f, fitted to the manufacturer's chart shape. Ten shots carry a ± 2.4 R scatter; surface, moisture and direction each shift the raw reading (trowelled skin +3.5, rough −3.0, saturated −2.5, downward +3, upward −3 R) and the lab's chart corrections recover 70 % of each shift - the residual is what sloppy practice still costs. The pulse runs at 2.7 + 0.042 f km/s, about 2 % faster when saturated (Shetty), losing 20 % through honeycomb and 38 % across a crack - teaching values for the defect factors.
Limits. Real correlations are aggregate- and cement-specific and must come from cores (Shetty); rebound charts per direction are manufacturing data, compressed here to ±3 R; the ± 15-20 % band and the RILEM warnings are his. Path length, coupling quality and steel in the path each move real PUNDIT readings; the lab fixes the path at 600 mm and the coupling at "properly oiled".
References: Shetty, Concrete Technology, testing of hardened concrete (the Schmidt hammer and its limitations, the ± 15-20 % calibrated variation, the RILEM survey verdict, pulse velocity equipment and factors, Leslie & Cheesman’s Table 10.4 ratings, and the combined-method recommendation); ASTM C805 (rebound) and C597 (pulse velocity); IS 13311-I and II; ACI 228.1R.
GOVERNING PRINCIPLES & DERIVATIONS
Ultrasonic Wave Propagation, Acoustic Impedance & Rebound Calibration
Pulse Velocity (ASTM C597 / IS 13311-1)
Direct transmission (transducers on opposite faces) gives the cleanest wave arrival.
L = 0.60 m path · Δt: transit time (μs) · Ed: dynamic modulus · ρ: density · μ: Poisson's ratio
Defect Diffraction & Acoustic Impedance
Acoustic impedance mismatch causes 99.99% reflection at air voids; waves diffract around perimeter.
Concrete Z ≈ 8 × 10⁶ Pa·s/m vs. air Z ≈ 400 Pa·s/m detours pulse and drops velocity 20–40%.
Leslie & Cheesman Grading (Table 10.4)
Higher velocity indicates dense aggregate packing and minimal capillary void space.
Below 3.0 km/s indicates interconnected voids, severe microcracking, or unconsolidated honeycombing.
SONREB Combined Principle
Schmidt rebound R assesses outer 25–30 mm mortar skin; UPV averages bulk core.
Moisture raises V (+2%) but drops R (−2.5 R); carbonation inflates R (+3 to +5 R). Combining both cancels bias.
The 2006 De la Concorde Overpass Collapse (Laval, Quebec)
A 65-foot section of the De la Concorde overpass suddenly collapsed onto the freeway below, killing 5 motorists and injuring 6 others. The failure occurred along an internal horizontal shear crack and honeycomb zone within the cantilever half-joint (corbel) support.
⚒ Student Laboratory Challenges & Self-Check Missions
Mission 1: The Hidden Honeycomb Trap
Select Smooth formed surface with an Internal Honeycomb Void. Fire the hammer, then send the pulse. Can the hammer see it?
Mission 2: The Carbonated Skin Illusion
Set surface to Carbonated / Dry with sound concrete. How does surface calcite crystallization distort the Schmidt reading?
Mission 3: Acoustic Wave Barrier
Select Transverse Delamination Crack and click Send the pulse. What happens to transit time and velocity?
CONCRETE / LAB 07 / DURABILITY
Buy the years with the mix.
Strength is what the structure needs; durability is what it keeps. Pressurise a specimen under 5 bar and count what crosses it, then run sixty years of carbonation against the cover that shields the steel - and find the exposure class whose rules your mix actually passes.
LABORATORY APPARATUS
Permeability cells & the phenolphthalein carbonation test
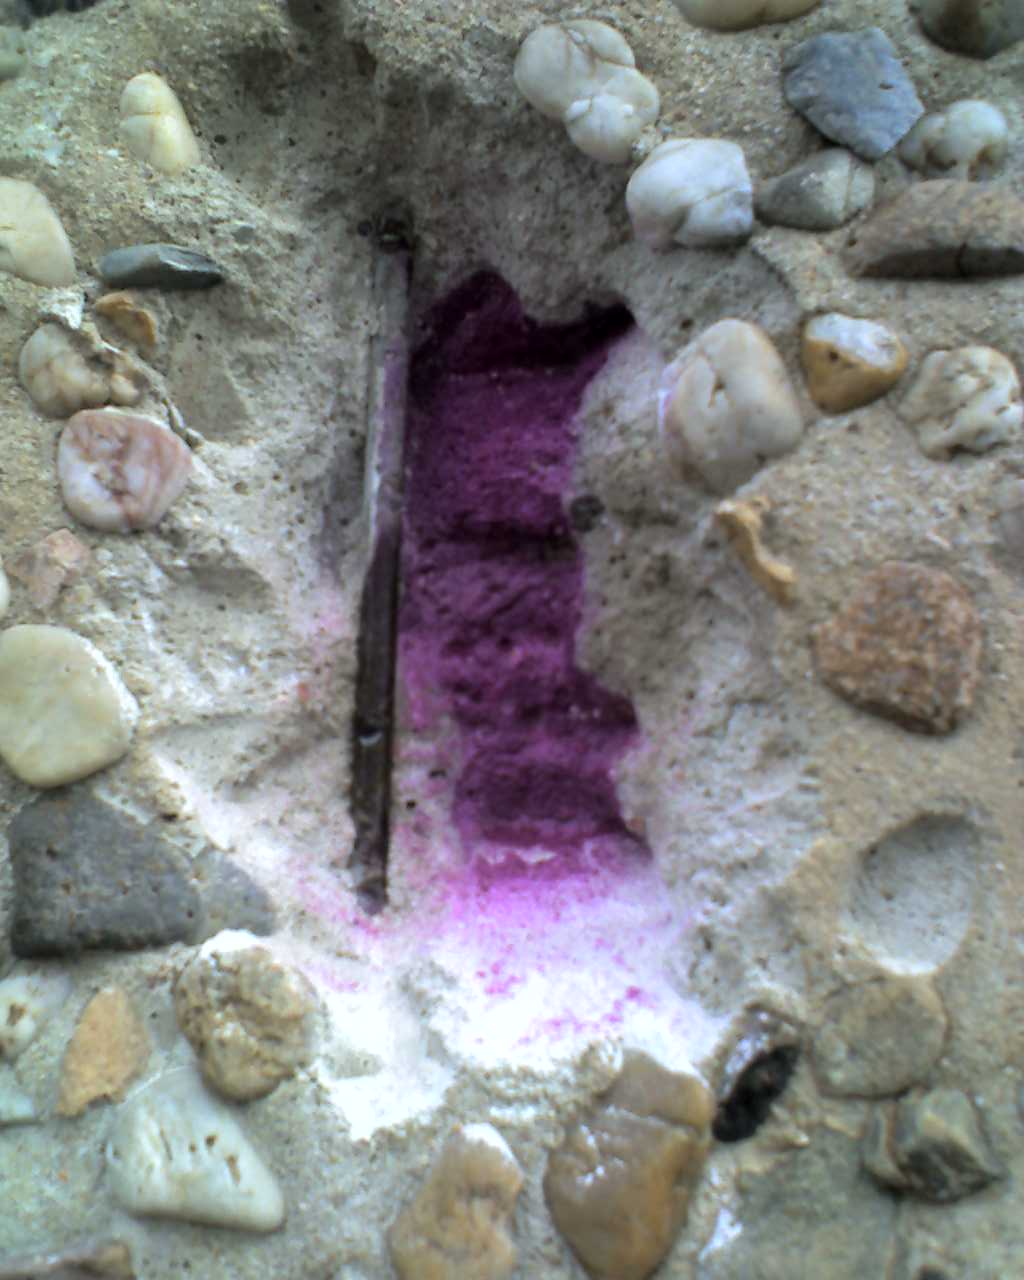
What you are looking at in the lab DIN EN 12390-8 / ASTM C1202
- Pink ZoneAlkaline Matrix (pH > 9.2): Calcium hydroxide (Ca(OH)₂) in hydrated cement paste maintains an alkaline pore solution (pH 12.5–13.5) that forms a self-healing gamma-Fe₂O₃ passive film over steel rebar.
- Clear ZoneCarbonated Layer (pH < 8.5): Atmospheric carbon dioxide reacts with hydration products (Ca(OH)₂ + CO₂ → CaCO₃ + H₂O). This neutralizes alkalinity; when the front reaches the bar, the passive film collapses and rust initiates.
- Time LawSquare Root of Time (x = k√t): Carbonation depth advances proportionally to the square root of time. Doubling the protective concrete cover depth quadruples the time required for the front to reach the steel.
- Water CellDIN EN 12390-8 Permeability Cell: Pressurizes water onto concrete faces at 5 bar (500 kPa) over 72 hours. Dense mixes limit penetration to < 25 mm, whereas porous mixes permit complete flow-through.
The member
FROM THE TWO RUNS
The durability case
Two numbers carry the whole durability argument. The coefficient says what can travel through the section: Shetty’s rock table calibrates the eye - dense trap 2.47 × 10⁻¹⁴, marble 2.39 × 10⁻¹³, granite 5.35 × 10⁻¹¹ m/s, and his dam concretes sat at 8-35 × 10⁻¹² m/s. The clock says when the ingress costs money: carbonation drops the pH from about 13 past 9, the passivating layer dies and the steel rusts - Table 9.12’s M 20 reaches 25 mm at 50 years while M 40 reaches 4, which is the whole case for w/c and cover.
WHAT THE TWO RUNS DECIDE
The durability sheet
Four rows in the order a durability argument runs: the code’s w/c cap and grade floor for the exposure (IS 456 Table 9.18), the watertightness the cell measures, the cover the carbonation clock tests, and the signature that needs all three. Shetty’s warning stays on the sheet: the aggregate and the transition zone - not the paste - are what leaks, the bleeding channels of a wet mix never segment, and no surface treatment rescues a weak or friable cover.
WHY IT MATTERS
The years are bought at the mixer
Every durable structure is a w/c ratio held low and a cover kept thick - everything else is refinement. The same water that made the mix workable leaves the capillaries that later carry chlorides to the steel, feed the sulfate reactions, and let the frost work. The code answers with two levers per exposure: a free w/c cap (0.55 mild down to 0.40 extreme) and a cover schedule (20 up to 75 mm), and the labs behind this one show how both are spent - the air lab’s entrained bubbles cut permeability, the curing lab’s maturity decides whether the cover ever finishes hydrating, and the binder lab’s slag and fly ash narrow the paths further. Where the hammer and the pulse finish at the report, this lab finishes at the drawing board: the cheapest durable structure is the one whose mix and cover were right before the first truck left the plant.
Notes, model limits and references
What this lab models. The paste permeability is fitted through Shetty’s Table 9.2 rock equivalents - dense trap, marble and granite at w/c 0.38, 0.48 and 0.70 (log10 k = −17.61 + 10.47 × w/c, within about 10 % of all three points) - and multiplied by teaching factors for the paths real concrete adds: larger aggregate (1.2 / 1.5 / 2.5 for 10 / 20 / 40 mm, the transition zone), binder (PPC 0.65, slag 0.5 - the pozzolanic and low-diffusivity effects Shetty describes) and curing (14-day 1, 7-day 1.5, site air 2.5). The coefficient drives a real Darcy flow through the 150 mm cube (Q = k A H / L at the 5 bar head, so the readout is the water the cell would actually collect); the bands are anchored on Table 9.3’s dam concretes (8-35 × 10⁻¹² m/s) and the granite line of Table 9.2 (5.35 × 10⁻¹¹ m/s), and above w/c 0.70 the model holds Shetty’s continuous bleeding channel warning. The carbonation rate is his Table 9.12: x = k√t with k = 3.5355 × (20 / f)^2.64 mm/√yr, which reproduces both grades (M 20: 25 mm and M 40: 4 mm at 50 years); the strength is the same Abrams curve as the strength and NDT labs.
Limits. Real coefficients are dominated by site factors this lab compresses into three multipliers, and absolute values scatter by an order of magnitude between test methods (IS 3085, DIN 1048, ISAT); the flow is the Darcy number for a sound cube, not a crack-tolerant member. Carbonation also depends on humidity (fastest at 50-70 % RH, near zero when pores are saturated or bone dry - Shetty), on exposure time to CO2 (rural 0.03 %, cities to 0.3 %), and on curing; binder choice is deliberately kept out of the carbonation rate because at equal 28-day strength fly ash carbonates about the same (PCA) - the lab’s one deliberate simplification is the single f for both mechanisms.
References: Shetty, Concrete Technology, Durability of Concrete (paste and concrete permeability, Tables 9.1-9.3; carbonation, pH and Tables 9.12-9.13; the IS 456 exposure and cover tables reproduced as Tables 9.16-9.18; surface treatments and the wall-effect note); PCA, Design and Control of Concrete Mixtures 15th ed. (durability and service life, Ch. 2 and 11; SCMs and permeability, w/cm and carbonation, Ch. 9); IS 456:2000 (durability clauses, Tables 5 and 16); IS 3085 and DIN 1048 (permeability tests); ASTM C1202 (rapid chloride penetration, the coulomb cousin of this cell).
GOVERNING PRINCIPLES & DERIVATIONS
Permeability Physics, Darcy Flow & Carbonation Kinetics
Darcy's Law for Concrete
Effluent volume under hydrostatic head per DIN 1048 / IS 3085 permeability testing.
k: permeability (m/s) · A = 0.0225 m² (150 mm face) · ΔH = 51.0 m (5 bar) · L = 0.15 m
Powers' Pore Transition
Above w/c 0.60, capillaries never segment even after 28 days of water curing.
Continuous bleeding channels increase permeability by four orders of magnitude (10−13 → 10−9 m/s).
Carbonation Front Kinetics
Atmospheric CO2 neutralizes alkaline Ca(OH)2, dropping pH below 9.0 and destroying passive oxide film.
Higher grade fck densifies outer cover paste, dramatically slowing the ingress coefficient kcarb.
Depassivation Service Life
Time required for neutralization front to reach reinforcement depth c (clear cover).
Due to square-root diffusion kinetics, doubling cover (20 → 40 mm) quadruples service life (25 → 100 yr).
The 2021 Champlain Towers South Collapse (Surfside, Florida)
In June 2021, a 12-story oceanfront residential condominium tower suffered a sudden, catastrophic partial collapse in the middle of the night, claiming 98 lives. The initial failure originated in the pool deck slab structure directly above the underground parking garage.
⚒ Student Laboratory Challenges & Self-Check Missions
Mission 1: The Bleeding Channel Deluge
Increase w/c from 0.40 to 0.75. Watch the Darcy permeability coefficient k and 24-hour effluent volume under 5 bar pressure.
Mission 2: Cover Depth vs. 50-Year Carbonation
At w/c = 0.55 with OPC, test 20 mm cover vs 45 mm cover. What happens to the steel after 50 years?
Mission 3: Slag & Microstructure Refinement
Switch binder from OPC to Ground Granulated Blast-Furnace Slag (GGBS). Why does water permeability drop by half?
CONCRETE / LAB 08 / CAPSTONE
Design it, then defend it.
Every lab before this one was a constraint. The brief names the exposure and the placing; the code names the w/c cap, the cement floor and the grade; the mixer turns the design into a batch; and the 28-day cubes decide whether the sheet gets signed - all of it bought at the leanest binder the brief will accept.
LABORATORY APPARATUS
Trial batching, pan mixer & slump verification
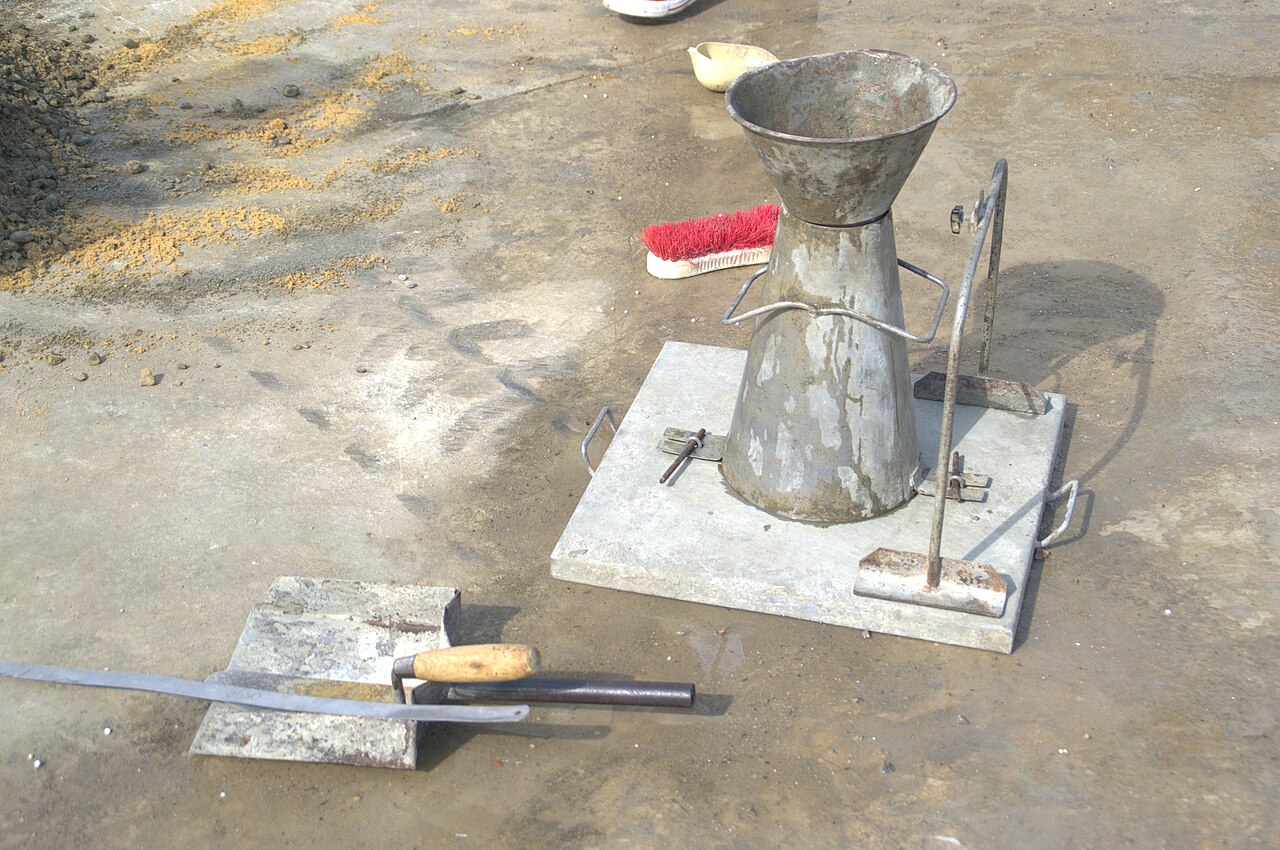
What you are looking at in the design office & laboratory ACI 211.1 / EN 206 / IS 10262
- Target MeanTarget Strength Formula: f'cr = f'c + 1.65 s (or f'ck = fck + 1.65 s), ensuring no more than 5% of site tests fall below specified design compressive strength.
- Water & w/cWater Selection & w/c Cap: Free water demand is selected based on nominal maximum aggregate size (NMAS) and target slump; w/c ratio is governed by strength curves and capped by code durability exposure limits.
- Absolute VolumeAbsolute Volume Balance: Volume of all constituents (Water + Cement + Entrapped Air + Coarse Aggregate + Fine Aggregate) equals precisely 1.0 m³ (1000 L).
- Trial ConfirmationThe Trial Batch Rule: If fresh slump deviates from design target or 28-day trial cylinder/cube compressive strength fails to clear the margin, water or aggregate proportions are adjusted iteratively before full-scale site batching.
The design office
FROM THE TWO RUNS
The design sheet
The sheet runs the whole course in one column. The water comes from Table 11.24 moved by the placing (± 3 % per 0.1 of compacting factor) and by the admixture; the exposure fixes the w/c ceiling (0.55 mild down to 0.40 extreme) and the cement floor (300 to 360 kg/m³, adjusted for aggregate size); the Abrams line the strength lab pinned turns the target mean into the w/c the cubes need; and the absolute-volume equations split whatever is left into sand and stone once the binder and air have taken their share. The verdict row quietly enforces the economics Shetty puts first: least cement consistent with strength and durability - and the surplus is measured in rupees and in heat.
WHAT THE TWO RUNS DECIDE
The four rows
Four rows, in the order the industry reads a design sheet: the mix against the code (w/c cap, cement floor, the 450 kg/m³ ceiling and the brief’s grade floor), the trial slump against the placing band, the 28-day cubes against fck + 1.65 s, and the signature - which needs all three, at the leanest binder. Behind the row that signs sits the field batch: the moisture corrections of the batch-water lab (a wet sand gives water back, the absorptive stone takes it) turn the SSD design sheet into the 50 kg bag the site will actually weigh.
MIXING CAUSALITY & BATCHING PHYSICS
The sequence dictates the paste
Mix design numbers on paper assume 100% homogeneous dispersion in the mixer drum. If dry cement is dumped directly onto wet aggregates, water immediately hydrates only the outer skin of cement clusters, creating impermeable unhydrated "cement balls" (dough lumps) that cannot be sheared apart. This wastes up to 35% of the binder, drops slump, and permanently sacrifices compressive strength. The two-stage sandwiched method wets the stone first, micro-grinds cement flocs using sand particles, and delays superplasticizer addition to avoid C3A flash adsorption.
IS 10262 model derivations, reference limits and citations
Proportioning Engine: IS 10262:1982 / IS 456:2000 target mean strength f'ck = fck + 1.65 s. Free water from Table 11.24 corrected for compacting factor (+3% per 0.1) and superplasticizer water reduction. Cement content checked against Table 9.18 durability exposure floors and the 450 kg/m³ maximum thermal limit. Absolute volume balance computes fine and coarse aggregate split per sand grading zone.
References: Shetty, Concrete Technology, Ch. 11 (Mix Design worked examples & mixer charging); Neville, Properties of Concrete, 5th ed., Ch. 5 (Mixer efficiency, sequence of charging, and cement balling prevention); ASTM C192 / IS 10262:2019.
GOVERNING PRINCIPLES & DERIVATIONS
IS 10262 Mix Proportioning Arithmetic & Absolute Volume Balance
Target Mean Strength (f'ck)
Ensures 95% statistical confidence that cube results exceed characteristic strength fck.
s = standard deviation from IS 456 Table 8 (4.0 MPa for M 20–25, 5.0 MPa for M 30+).
Durability Floor vs. Cement Content
Mix cement content must satisfy the environmental durability floor and not exceed 450 kg/m³.
Free water Wfree is corrected for aggregate shape and superplasticizer water reduction.
Absolute Volume Balance Equation
Compact fresh concrete volume equals sum of absolute solid volumes of all constituents.
W: water · C: cement (SG 3.15) · Vair: entrapped air % · fa, ca: fine and coarse aggregate (SG 2.60)
Field Moisture & Absorption Correction
Stockpile aggregates depart from SSD condition; batch weights must adjust to preserve target w/c.
m: surface moisture % · A: water absorption % · Free water is deducted, dry absorption is added.
The Big Dig Slurry Wall Thermal Cracking (Boston, USA)
During construction of the multi-billion-dollar Central Artery/Tunnel (Big Dig), massive 1.5–2.0 meter thick diaphragm walls and foundation invert slabs were poured using an over-cemented mix exceeding 480 kg/m³ of pure Type I Portland cement to meet aggressive 28-day early strength targets.
⚒ Student Laboratory Challenges & Self-Check Missions
Mission 1: The High-Rise Pump Mix Design
Select Grade M 35 with 20 mm aggregate and Zone II sand. Add a Superplasticizer. Compare required cement content with and without admixture.
Mission 2: Durability Floor vs. Strength Demand
Select Water Tank Wall (Severe exposure) with an M 20 mix. Look at the cement row on the design sheet.
Mission 3: Fine Aggregate Grading Zone Impact
Switch Fine Aggregate from Zone I (Coarse sand) to Zone IV (Very fine sand). How does sand percentage adjust?
MATERIALS OF CONSTRUCTION / VIRTUAL LABORATORY
Test it hot.
Trust it cold.
Asphalt is a partnership between a temperature-sensitive binder and a graded stone skeleton. Test the drum, pick the grade for the climate, blend the stockpiles and design the mix - one experiment at a time.
Start exploringExplore the asphalt labs
5 interactive experimentsBinder tests
Run the needle and the ring & ball: identify the VG grade of every drum and catch the one whose stencil lies.
Interactive needle & ring bench 02 / CLIMATE & GRADEGrades & climate
VG-10 to VG-40: match the grade to the design air temperature and read the mixing and compaction window.
Interactive climate & plant bench 03 / THE SKELETONGrading for mixes
Blend the stockpiles to the BC and DBM envelopes, with filler and a dust ratio that passes.
Interactive stockpile blending 04 / THE MIXMarshall mix design
Compact briquettes at four binder contents: stability, flow, air voids and the optimum that balances them.
Interactive hammer & breaking head 05 / WATERMoisture damage
Soak the briquettes and re-test: retained stability, stripping and what an antistripping additive buys.
Interactive soak & split benchASPHALT / LAB 01 / THE BINDER
Read the drum.
Every drum of bitumen arrives stencilled with a grade - and every stencil is a claim. Release the needle at 25 °C, let the balls drop in the ring & ball, and find out what each drum really is: the honest ones, the trader’s blend, and the one whose stencil lies.
The bench
FROM THE TWO RUNS
The test certificate
WHAT THE TWO RUNS DECIDE
The identity check
Acceptance criteria, code clauses & references
The four receiving checks: needle against stencil (IS 1203), softening point against stencil (IS 1205), the pair against IS 73:2013 Table 1, and the release decision. Absolute viscosity at 60 °C (IS 1206 Part 2) is the governing specification parameter; penetration and softening point provide rapid batch-level field verification.
Standards & limits: IS 73:2013 (Paving bitumen Table 1); IS 1203 (penetration); IS 1205 (softening point); IS 1208 (ductility on RTFO residue); IS 1202 (specific gravity); IS 1448 [P:69] (flash point); MoRTH Section 500 clause 501.2.
ASPHALT / LAB 02 / CLIMATE & GRADE
Match the binder to the year.
A road never lives at one temperature. Read the weather-station sheet, let IS 73:2013 and MORTH Table 500-1 pick the grade between the hottest afternoon and the coldest night, then set the plant the way Table 500-2 demands - and find out what a cold paver or an overheated tank does to a trial strip.
The project sheet
The plant
FROM THE TWO DECISIONS
The job mix sheet
The three strips are the numbers a paving crew actually lives by: the mixing window is fixed by Table 500-2 the moment the grade is chosen, the dark marker is the binder and the grey one the aggregate, the paver minimum keeps the mat workable under the screed, and the roller minimum is the last chance to compact. A mat that cools past those minima looks fine on the paver and reads low density in every core cut the next morning.
WHY THE GRADE HAS A WINDOW
The binder, against temperature
WHAT THE TWO DECISIONS DECIDE
The job mix formula check
Specifications, plant windows & code clauses
Climatic & plant criteria: MoRTH Table 500-1 selects the grade from high and low daily mean air temperatures; IRC 111 recommends stepping up to VG-40 or PMB for heavy traffic (> 2000 CVPD). MoRTH Table 500-2 fixes plant mixing, laying, and rolling windows, while clause 501.3 enforces a 14 °C maximum aggregate-to-binder differential.
Standards: IS 73:2013 clause 5; MoRTH Section 500 (Tables 500-1, 500-2, clause 501.3); IRC 111:2009 Tables 2-4; IRC 37:2018 clause 9.
ASPHALT / LAB 03 / THE SKELETON
Build the skeleton first.
A bituminous mix is a stone skeleton with a binder film; the binder cannot repair a bad skeleton. Blend the five stockpiles of a crushing plant to the MORTH envelope of the mix you are making - BC Grading 1 or 2, DBM Grading 1 or 2 - keep the curve free of gaps and the fines-to-bitumen ratio inside its window, and watch how the nominal size of the mix decides which piles may even enter the blend.
The mix and the yard
FROM THE BLEND
The gradation sheet
WHAT THE BLEND DECIDES
The job mix formula check
Specifications, gap-grading rules & references
Volumetric skeleton criteria: MoRTH Section 500 Tables 500-10 (DBM) and 500-17 (BC) define envelope bands. Clause 505.2.5.1 / 507.2.5 forbids gap grading across adjacent sieves to prevent compaction instability and mechanical segregation. Clause 505.3 enforces dust-to-binder ratio ($P_{0.075}/P_{be}$) between 0.6 and 1.2 to avoid mastic embrittlement or bleeding.
Standards: MoRTH Specifications for Roads and Bridges (5th revision, Tables 500-10, 500-17, 500-18, clauses 505.2.5, 505.3); IRC 111:2009 Tables 6-9; IS 2386 Part 1 (wet sieving); Asphalt Institute MS-2.
ASPHALT / LAB 04 / THE MIX
Find the optimum.
Compaction is a conversation between stone and binder: too little binder and the mix stays open and weak, too much and it bleeds and ruts. The Marshall bench answers it the way every asphalt plant does - five briquettes at five binder contents, 75 blows per face, broken at 60 °C - and the curves that come out decide the binder content the job mix formula will carry.
The mix on the bench
FROM THE BENCH
The design sheet
The five volumetric strips are the plant’s contract with the laboratory. Stability & flow are read at failure; air voids, VMA and VFB emerge from bulk and maximum theoretical gravities.
THE FIVE-POINT SERIES
Six curves, one optimum
WHAT THE DESIGN DECIDES
The job mix formula check
Field Volumetric Physics & Failure Modes
The Double Hazard: Binder is the most critical component governing asphalt durability. Under-dosing (lean mix, Va > 5%) exposes aggregate facets to stripping, air oxidization, and brittle fatigue cracking. Over-dosing (rich mix, Va < 3%) eliminates expansion void space; summer sun heats the asphalt to 60°C, expanding the bitumen and forcing it to flush to the surface, precipitating fatal plastic rutting and hydroplaning hazards.
Aggregate Mineralogy Impact: Highly porous and absorptive aggregates (such as sandstone or vesicular basalts) soak up effective binder, collapsing the VMA safety buffer and requiring higher asphalt content. Hard crystalline aggregates (granite) preserve void volume but require chemical anti-stripping agents.
References & Standards: MoRTH Specifications for Roads and Bridges (5th Revision, Section 500, Clauses 505.3, Table 500-11, Table 500-12); IRC 111:2009; Asphalt Institute MS-2 (7th Edition); ASTM D6926, ASTM D6927, ASTM D2041, ASTM D2726.
ASPHALT / LAB 05 / WATER
Water always gets in.
Asphalt looks waterproof and is not: every wet mix is a small civil war at the interface between stone and binder, and the water is on the stone’s side more often than not. Condition the briquettes - vacuum saturation, a 60 °C soak, and for the severe story a freeze-thaw cycle - split them against a dry control set, and decide what the specification demands you add before the mix goes to the plant.
The moisture bench
FROM THE TWO RUNS
The moisture sheet
Dual compliance criteria: AASHTO T283 requires conditioned tensile strength ratio (TSR) ≥ 80 %; IS 6241 visual stripping requires ≥ 95 % retained film coating after static water immersion.
WHAT THE WATER DECIDES
The moisture check
Physical Chemistry of Adhesion & Stripping Mechanisms
Thermodynamics of Surface Energy: Aggregate surfaces exhibit polar electrostatic charges. Siliceous rocks (granite, quartzite, sandstone) have acidic surfaces rich in electronegative silica (SiO2), which possess high interfacial affinity for polar water molecules. When moisture enters, water physically displaces non-polar bitumen films (hydrophilic debonding). Basic calcareous aggregates (limestone) form insoluble calcium-bitumen salts, resisting stripping.
Hydrated Lime Passivation (IRC 111 clause 3.4.2): Dosing 2% hydrated lime [Ca(OH)2] by aggregate weight reacts with carboxylic acids in bitumen to form water-insoluble calcium salts while chemically passivating acidic silica sites, elevating TSR above 80% and preventing stripping.
In-Situ Air Voids & Pore Pressure: Compacting to in-place air voids ≤ 7% is crucial. Under heavy traffic tires, saturated interconnected voids generate dynamic hydraulic pore pressure pulses that blast bitumen films off unpassivated rock surfaces.
Standards & References: MoRTH Specifications for Roads and Bridges (5th Revision, Section 500, Clauses 501.2.2, 507.3.5, Table 500-8, Table 500-11); IRC 111:2009; AASHTO T283; IS 6241; IS 73:2013.
MATERIALS OF CONSTRUCTION / VIRTUAL LABORATORY
From the soil
to the surface.
A pavement is a chain of decisions: the soil it stands on, the traffic it must carry, the crust those two numbers buy, and the surface the wheels finally meet. Test the chain link by link - one experiment at a time.
Start exploringExplore the pavement labs
5 interactive experimentsSubgrade & CBR
Soak the mould, push the plunger and turn six section tests into the one design value the crust is built on.
Interactive CBR bench 02 / THE LOADTraffic & design traffic
Count the commercial vehicles, grow them to the opening year and multiply by the fourth power of the axle load.
Interactive growth & weigh pad 03 / THE CRUSTFlexible pavement design
Build the layers against the required structure number - and find out what every millimetre of asphalt is worth.
Interactive cross-section 04 / THE SURFACESkid resistance
The pendulum and the sand patch: microtexture, macrotexture and the wet bend that punishes a polished stone.
Interactive pendulum & sand patch 05 / THE RECORDDistress survey
Walk the section, record every defect, and turn the sheet into an index and a maintenance programme.
Interactive condition surveyPAVEMENT / LAB 01 / THE GROUND
Everything rests on the soil.
A pavement is only as good as the layer no one sees. The soaked California Bearing Ratio turns a soil into one number - and IRC 37 then asks a harder question: what does the whole section of soil promise, spot by spot, once the weak places are counted honestly?
The mould and the section
FROM THE TEST AND THE SECTION
The subgrade sheet
The two ratios rarely agree: the curve softens, and the code says the 2.5 mm value is the one to read - unless the 5.0 mm ratio comes out higher, in which case the test is repeated before the higher value is used. The swell beside them is the soil telling you how much it moves when it gets wet, which is why a plastic clay is a drainage problem before it is a strength problem.
WHAT THE TWO RUNS DECIDE
The subgrade check
Four rows, the way a geotechnical report argues it: the curve, the way the specimen was made and soaked, the section value the design will actually use, and the handover. The design CBR is a deliberate pessimism - the value that at least 90 % of the section still meets - and it is the single number the whole pavement thickness is an argument about.
WHY IT MATTERS
The weakest link is the subgrade
Every pavement distributes the wheel load down through the layers until the pressure is gentle enough for the soil to carry, so the whole structure is sized from the soil's strength. That is why the test protocol is so fussy: a specimen rammed at 93 % of its potential density, or tested dry, can read twice the CBR of the same soil built and soaked the way the site will hold it. A subgrade that reads 8 % in the laboratory and behaves like 3 % under the first monsoon is how a road fails in its second year with no distress visible in the asphalt, only a wave in the surface and cracks that follow the wheelpaths. The cheap decisions - drainage, compaction, stabilisation of the top 300 mm - are all made here, and they are far cheaper than designing the crust for a soil strength the site never achieves.
Notes, model limits and references
What this lab models. Five illustrative soil families with soaked CBR and swell values, a compaction level that scales the reading, the dry-versus-soaked comparison, a smooth pressure-penetration curve whose shape follows the soil (granular soils stiffen past 2.5 mm, plastic clays soften), the repeat rule of the test, and six spot values per soil from which the 90th or 80th percentile is taken the way IRC 37 spells it out: at least that share of the section must equal or exceed the design value.
Limits. The soils are teaching families, not a specific borrow area; the swell is indicative; the section values carry a plausible spread rather than a site investigation; and the compaction scaling (about 3 % of CBR per point of density) is a laboratory rule of thumb. None of this replaces the actual test, and the design must be re-read wherever the soil changes.
References: IRC 37-2018 clauses 6.2-6.3 (test conditions, frequency, design percentile; resilient modulus correlations); IS 2720 Part 16 (the laboratory CBR test); IS 2720 Part 8 (Proctor compaction); IRC SP:72 (low-volume roads below the IRC 37 charts).
PAVEMENT / LAB 02 / THE LOAD
Count the axles, not the cars.
A pavement does not fail from the vehicles it carries - it fails from the axles, raised to the fourth power. Count the commercial traffic, grow it to the opening year, split it over the carriageway and convert it into the only currency the design understands: millions of standard axles.
The traffic sheet
FROM THE ASSUMPTIONS AND THE COMPUTATION
The design traffic sheet
The msa value is the hinge the whole design turns on. Below 2 msa the rural roads catalogue takes over; from 2 to 150 msa the IRC 37 catalogues give the crust directly; above that the design needs an analysis of its own, and beyond 300 msa the road is expected to be built for a long life. A growth rate assumed too low, or a damage factor read from the table when the road carries overloaded trucks, moves the design by whole thicknesses - which is why the assumptions are committed on the sheet before the arithmetic is allowed to run.
WHAT THE SHEET DECIDES
The traffic check
Four rows: the damage factor, the lateral split, the arithmetic and the design route. The fourth power is the whole argument of this lab - a 16 t single axle does the damage of fourteen 8.2 t standard axles - and it is why a market road carrying a handful of overloaded trucks can need a heavier crust than a suburban road carrying ten times the number of small ones.
WHY IT MATTERS
The fourth power is merciless
Axle load damage does not grow with the load; it grows with the fourth power of the load, because the bending stress in the pavement grows with the load while the fatigue life of the material falls with the stress raised to a high power. One axle at twice the legal limit does sixteen times the damage of a legal one - which is why a single overloading season can deliver a decade of design traffic, and why enforcement is a pavement-design tool. It is also why the vehicle damage factor exists at all: the code absorbs the whole axle load spectrum of a route into one multiplier, and the difference between the hilly and rolling terrain columns - 0.6 against 1.7 at low volumes - is not about the hills, it is about what the trucks are doing on them.
Notes, model limits and references
What this lab models. The IRC 37-2018 arithmetic exactly: the count grown to the year of completion, the lateral distribution factor of the carriageway arrangement, the indicative VDF table of Table 4.2 (0-150 / 150-1500 / more than 1500 commercial vehicles per day, rolling-plain or hilly), the fourth power law on the weigh pad, and the design route boundaries of the guidelines (2 / 150 / 300 msa). The checklist tests the student's VDF against the table cell, the lateral factor against the arrangement, and reads the class consequences.
Limits. The VDF table is the code's fallback for small projects; a real design should carry an axle load survey, and the model says so in its notes rather than pretending the table is the truth. Tandem and tridem axles are not simulated separately (their damage is an interaction of spacing and load), and the traffic is treated as one growing stream through the whole design period instead of changing rates.
References: IRC 37-2018 clauses 4.4-4.6, Table 4.2, Table 9.1; IRC SP:72 (rural roads); the fourth power law as set out in the AASHTO road test and carried into the Indian guidelines.
PAVEMENT / LAB 03 / THE CRUST
Buy structure, not thickness.
The traffic sheet and the subgrade sheet meet here. Build the crust - asphalt, base, subbase - and weigh it against the structure number the AASHTO equation demands: every layer counts in proportion to its material quality, its thickness and the drainage someone is going to maintain. The cheapest design is never the thinnest one; it is the one that exactly buys the structure the traffic needs.
The design sheet
FROM THE CHECK
The thickness sheet
The equation is deliberately unglamorous: below about SN 3 the subgrade strength dominates and the asphalt is a wearing course; above it the asphalt starts to do real structural work, and the numbers bend upwards quickly. The m-factors are the cheapest structure in the whole design - raising a base from poor to good drainage is worth roughly a tenth of its thickness in asphalt - and they are also the easiest to lose after the road opens, which is why the drainage that earns the factor belongs on the drawings, not in a hope.
WHAT THE CHECK DECIDES
The design check
Four rows: the required structure number and its inputs, the offered structure computed layer by layer, the construction minimums, and the release. A crust that satisfies the equation and fails the minimums is the classic first draft of a new engineer - and a crust that doubles the equation is the classic first draft of a generous one. The design lives between those two errors.
WHY IT MATTERS
The crust is a budget decision
Pavement design is where materials science turns into money. The same traffic can be carried by a thick granular base with a modest asphalt surface or by a thinner, stiffer asphalt over a weaker base, and the two schemes differ in first cost, in maintenance cost and in what happens in year fifteen. The structure number makes the trade explicit: an inch of asphalt is worth three to four inches of gravel base, and a well-drained base is worth more than a soaked one of the same stone. What the equation cannot see - and the engineer must - is everything the coefficients assume: the asphalt that passed lab 04, the aggregate that passed the grading envelope, the soil that was tested soaked in lab 01, the compaction the site actually achieves. The AASHTO number is a promise about materials, not a proof about construction.
Notes, model limits and references
What this lab models. The AASHTO 1993 flexible pavement equation solved for the required SN, the standard layer coefficients (AC 0.42-0.44, crushed stone base 0.14, gravel 0.11, crushed subbase 0.11, sandy subbase 0.08), mid-range drainage factors (1.20 / 1.10 / 1.00), the reliability factors of the standard normal table, and the AASHTO minimum thicknesses by design ESALs with a 100 mm floor on the subbase. The subgrade modulus comes from the CBR through the IRC 37 correlations, converted to psi for the equation.
Limits. The AASHTO 1993 method is one of several; IRC 37-2018 designs by layered elastic analysis with its own catalogues, and the two do not agree millimetre for millimetre - the lab teaches the mechanics of a structure number, not a legal design for a real project. The coefficients assume materials at their specified quality; the seasonal variation of the modulus, the buildability of thin layers and the cost data are outside the model.
References: AASHTO Guide for Design of Pavement Structures (1993), Part II chapter 2; IRC 37-2018 clauses 6.3 and 9 (subgrade modulus); MoRTH Specifications (Layer thicknesses and material requirements); Huang, Pavement Analysis and Design (the worked form of the equation).
PAVEMENT / LAB 04 / THE SURFACE
Stopping is a surface property.
Braking, steering and stopping all happen in the contact patch between rubber and stone - and both of them are tested on a wet day. The pendulum reads the microtexture the rubber grips; the sand patch reads the macrotexture the water escapes through. Get either wrong and the car does not stop.
The two surveys
FROM THE TWO SURVEYS
The skid sheet
The two numbers fail in different ways. Polishing lowers the pendulum value while the texture stays deep - the surface looks rough and grips like glass. Flushing, wear and over-rich mixes flatten the texture while the stone itself is still sharp - fine until the first heavy rain, when the water has nowhere to go and the tyre lifts off the road entirely. A surfacing that satisfies one and fails the other has not satisfied the site.
WHAT THE TWO SURVEYS DECIDE
The skid check
Four rows: the microtexture, the macrotexture, the life of the surfacing and the verdict. The third row is the one that separates a survey from a test: a surface read on the day it is laid has not been tested by anything, and the aggregates that polish do their work in the first few summers.
WHY IT MATTERS
The last metre of the stopping distance
Every design in this course ends at the same place: the contact patch, about the size of a hand, carrying the whole car. On a dry day the stone's microtexture cuts through and the friction is enormous; on a wet day the water is the lubricant and the drainage is the only escape. That is why the specification writes two requirements and not one, why the PSV - the polished stone value - of the chippings is a tender clause in its own right, and why the red high-friction surface appears on the approach to every signal and crossing: at exactly the places where braking is hardest, texture and microtexture are bought at a premium. A road that carries its traffic perfectly for twenty years and fails to stop one car in the rain has failed at the only job that mattered that day.
Notes, model limits and references
What this lab models. Five illustrative surfacings with their initial pendulum values, texture depths and polish rates; the polishing loss as a function of years and traffic (the square-root-of-traffic shape every skid-resistance policy assumes); and three site categories with their requirements. The bands follow the teaching practice of the UK guidance the course uses - about 45 BPN as the working line for fast wet sites and 0.65 mm of texture on high-speed roads - scaled to the site categories of the lab.
Limits. The numbers are illustrative; real acceptance criteria are written into each country's standard and vary with speed, site and rainfall. The pendulum itself is a spot test with real scatter, and the sand patch is operator-dependent - which is exactly why the lab talks about the life of the surface rather than one reading.
References: BS 7976 / ASTM E303 (the pendulum); the sand patch method for texture depth; the UK skid-resistance policy documents for the site-category framework; MoRTH Specifications (surface friction requirements in the wearing-course clauses).
PAVEMENT / LAB 05 / THE RECORD
Read the road like a story.
By the time the distress shows in the surface, the argument about its cause is usually over. Walk the section, record every defect you can actually see, and let the sheet answer the two questions that decide the budget: how bad is it, and which part of the structure is telling you.
The survey sheet
Click each distress on the section as you find it - the wheelpaths, the joints, the low spots after rain. When the sheet is full, read the index and the programme it points to.
FROM THE SURVEY
The condition sheet
The index runs from 100 down as the deducts add up; the bands and the maintenance policy that goes with them are marked on the strip.
This is the simple subtractive form of the pavement condition index: each distress carries a deduct by type and severity, the deducts are summed, and the score points at the policy. What makes it useful is not the arithmetic but the grouping - surface distresses, cracking and deformation are three different conversations about money.
WHAT THE SURVEY DECIDES
The programme check
Four rows: the walk itself, the dominant distress and its family, the index with its band, and the programme. The order matters: a survey that skipped half the section produces an index that reads like information while being an opinion, and a programme chosen from the biggest-looking defect rather than the heaviest deduct is how a surface treatment gets laid on top of structural cracking.
WHY IT MATTERS
Maintenance is a reading exercise
Distress is the pavement telling you which of its assumptions failed. Bleeding and rutting in the wheelpaths point back through the mix design to a rich binder content and a hot summer; raveling and stripping point back to the moisture bench and the aggregate that would not hold a film; alligator cracking points to fatigue - the structure, not the surface, has run out of load repetitions; thermal transverse cracks point to a binder that forgot how to relax on a frost night. The same acres of cracked road can therefore mean four completely different things, and the repair that ignores the cause is the most expensive repair of all, because it is done twice. The condition survey is the feedback loop of every laboratory in this course.
Notes, model limits and references
What this lab models. Seven illustrative distresses with their severity, deduct and family, the simple subtractive index of the ASTM D6433 idea, the standard condition bands with their maintenance policies, and the group logic that separates surface distresses from cracking and deformation. The survey gate - and the walk state of the sheet - is deliberately part of the lesson: an incomplete walk is scored as an incomplete walk.
Limits. Real PCI rating uses corrected deduct values, density and extent ratings and measured unit sizes; this lab uses type and severity only, and the numbers are teaching values, not a D6433 rating. Photographs, measured extents, deflection testing and coring are the tools the real investigation would add before a structural programme is chosen.
References: ASTM D6433 (the pavement condition index, simplified); IRC 37-2018 chapter 11 (maintenance and rehabilitation); the distress identification practice of the highway agencies; the material causes traced back through the labs of this workspace.